Figures & data
Figure 1 Flow diagram of study selection.
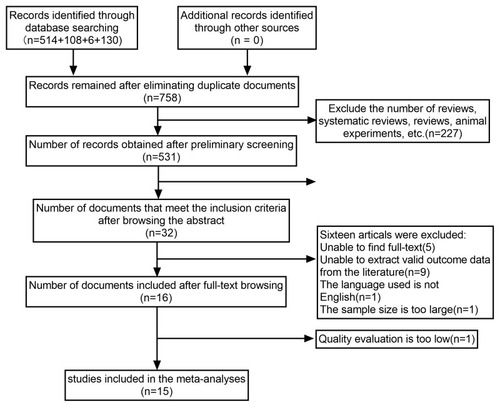
Table 1 Characteristics of Studies Included in the Meta-Analysis
Table 2 Quality Analysis Diagrams of the Included Studies
Table 3 Results of Subgroup Analyses Stratified by Studied Design, Geographic Area and Study Quality
Figure 2 Sensitivity analysis.
Abbreviation: CI, confidence interval.
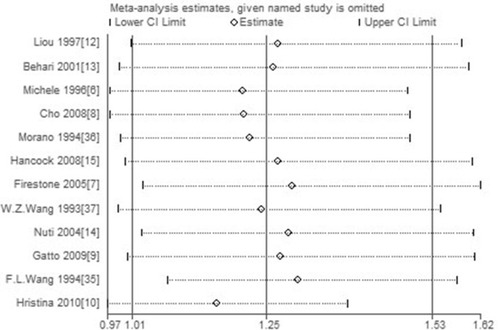
Figure 3 Forest plots for ever-well-water drinkers versus non-drinkers (95% CI).
Abbreviations: CI, confidence interval; OR, odd ratio.
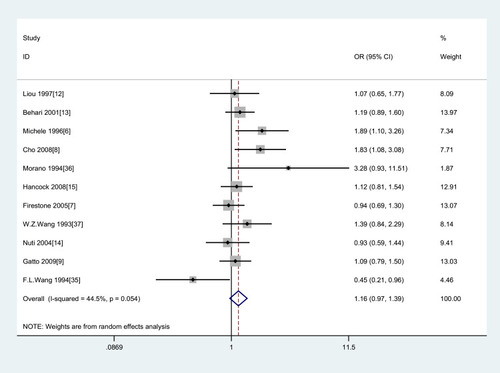
Table 4 Results of Individual Studies
Table 5 Results of Subgroup Analyses Stratified by Studied Design, Geographic Area and Study Quality
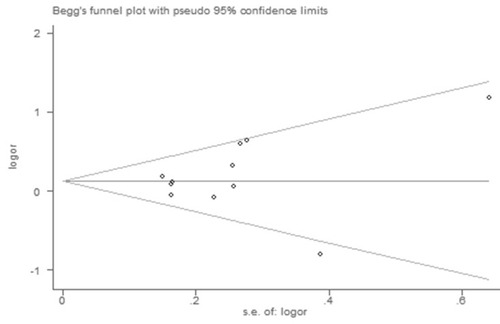
Figure 4 Funnel plot analysis to detect publication bias.