Figures & data
Table 1 Demographic data, diagnostic/clinical data, and baseline rating scale scores for patients receiving repetitive transcranial magnetic stimulation (active or sham group)Table Footnote*
Table 2 Mean scores for clinical, social and neurocognitive measures at baseline (pretreatment), week 4 (end of treatment), and week 6 (follow-up, postreatment week 2), time effect, and interaction to analysis of variance and false discovery rate at baseline versus week 4, week 4 versus week 6, and baseline versus week 6 in active and placebo groups (n = 14)Table Footnotea
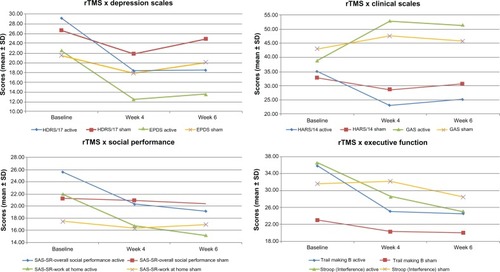
Figure 1 Change in mean values of clinical scales and neuropsychological tests at baseline (pre-treatment), weeks 4 (end of treatment) and 6 (follow up: post-treatment week 2) for active and placebo groups.