Figures & data
Table 1 Baseline characteristics and Thai HAM-D scores on follow-up visits for up to 12 months
Figure 1 Mean score of HAM-D subscales that were significantly decreased during the 12-month follow-up.
Abbreviation: HAM-D, Hamilton Depression score.
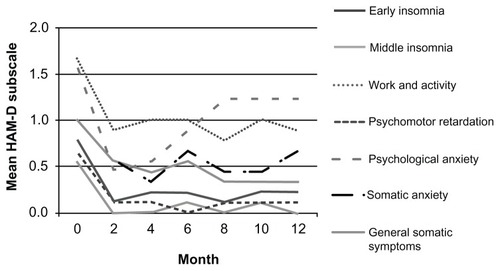
Figure 2 Mean score of HAM-D subscales that were not significantly changed during the 12-month follow-up.
Abbreviations: GI, Gastrointestinal; HAM-D, Hamilton Depression score.
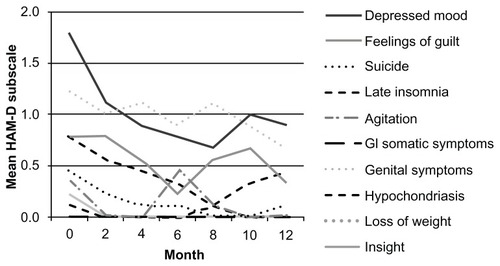
Table 2 HAM-D subscale evaluated every 2 months for 12 months using Friedman test