Figures & data
Figure 1 Methods overview. Image acquisition: images were acquired using a 3.0-T scanner. Preprocessing: preprocessing was performed using the FMRIB Software Library (FSL) and resulted in images of DTI indices (fractional anisotropy [FA], mean diffusivity [MD], axial diffusivity [AD], radial diffusivity [RD]). TBSS analysis generated skeletonized maps. Feature extraction: feature extraction was performed by extracting mean values of FA, MD, AD, RD, and ALL (voxel-wise combination of FA, MD, AD, and RD) from each participant. Five-fold cross-validation (CV) for each classification model was used for model training and model testing. Principal component analysis (PCA) was applied for both training data and testing data during CV. Final evaluation: final evaluation was performed using a classification performance estimator.
![Figure 1 Methods overview. Image acquisition: images were acquired using a 3.0-T scanner. Preprocessing: preprocessing was performed using the FMRIB Software Library (FSL) and resulted in images of DTI indices (fractional anisotropy [FA], mean diffusivity [MD], axial diffusivity [AD], radial diffusivity [RD]). TBSS analysis generated skeletonized maps. Feature extraction: feature extraction was performed by extracting mean values of FA, MD, AD, RD, and ALL (voxel-wise combination of FA, MD, AD, and RD) from each participant. Five-fold cross-validation (CV) for each classification model was used for model training and model testing. Principal component analysis (PCA) was applied for both training data and testing data during CV. Final evaluation: final evaluation was performed using a classification performance estimator.](/cms/asset/5136e86f-77ce-4749-99c9-a01e13327b13/dndt_a_12154100_f0001_c.jpg)
Figure 2 TBSS analysis showing a significant difference in FA between patients with TBI and healthy controls. The TBSS analysis revealed significant differences between the group of patients with TBI and the healthy control group. The mean FA skeleton, which represents the centers of main white matter tracts, is shown in green. The white arrows indicate the FA skeleton. Overlaid on the skeleton are the results of the statistical analysis. Red and yellow represent significant differences (red, p-value < 0.05; yellow, p-value < 0.01). The group of patients with TBI exhibited a widespread decrease in FA compared with the healthy control group.
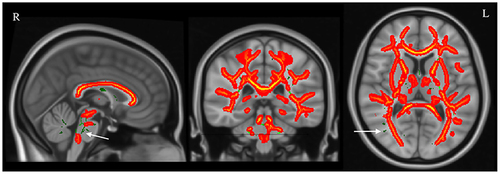
Figure 3 TBSS analysis showing significant differences in MD, AD, and RD between the group of patients with TBI and the healthy control group. The TBSS analysis revealed significant differences between the group of patients with TBI and the healthy control group. The mean FA skeleton, which represents the centers of main white matter tracts, is shown in green. Overlaid on the skeleton are the results of the statistical analysis. Red and yellow represent significant differences (red, p-value < 0.05; yellow, p-value < 0.01). The group of patients with TBI exhibited widespread increases in MD, AD, and RD compared with the healthy control group.
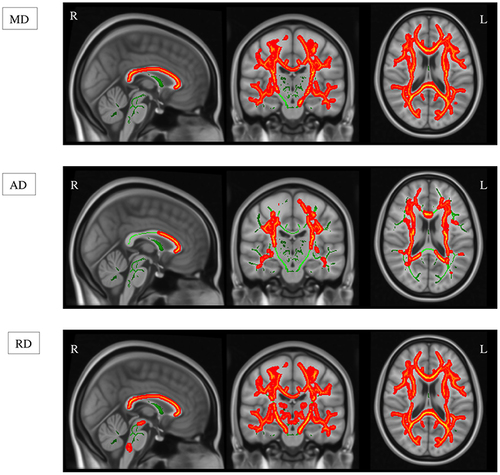
Figure 4 Comparison of DTI indices between the group of patients with TBI and the healthy control group. Boxplots show the distribution of the values (y-axis) of the FA, MD, AD, and RD indices. FA is expressed in arbitrary units; MD, AD, and RD are expressed as μm2/s. The horizontal line in the boxplot indicates the group mean, while the box indicates the upper and lower quartiles. The vertical lines represent the minimum and maximum values (p-value for FA < 0.001, p-value for MD < 0.006, p-value for AD < 0.002, p-value for RD < 0.001).
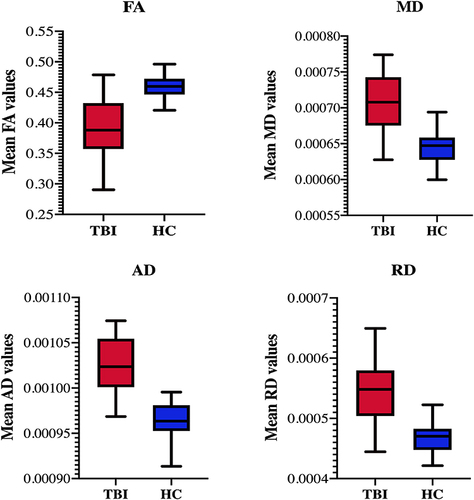
Table 1 Mean Accuracy Score for Each Classification Task
Figure 5 Receiver operating characteristic curves (ROC) for classification of patients with TBI and healthy controls. (A) Classification using skeletonized fractional anisotropy (FA) maps, (B) classification using skeletonized mean diffusivity (MD) maps, (C) classification using skeletonized axial diffusivity (AD) maps, (D) classification using skeletonized radial diffusivity (RD) maps, (E) classification using combined indices (ALL).
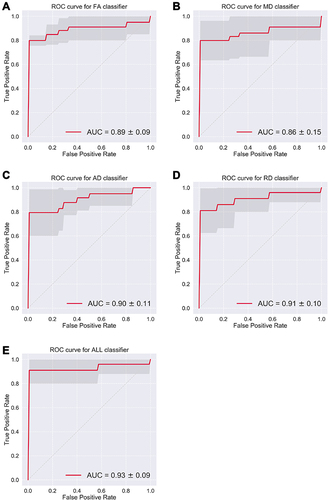
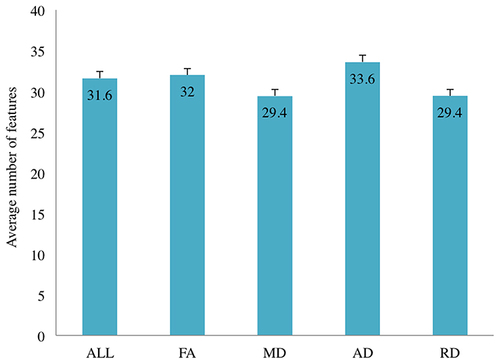
Figure 6 Average number of PCs used by each classifier task. The bar chart shows the number of PCs used by each classifier to differentiate patients with TBI from healthy controls.