Figures & data
Table 1 Baseline demographics and clinical characteristics
Table 2 Patient disposition and study medication exposure
Figure 1 Categorical CGI-S scores from baseline to end point.
Abbreviations: AP, antipsychotic; BL, baseline; CGI-S, Clinical Global Impression–Severity scale; EP, end point; Ris, risperidone; RLAI, risperidone long-acting injectable.
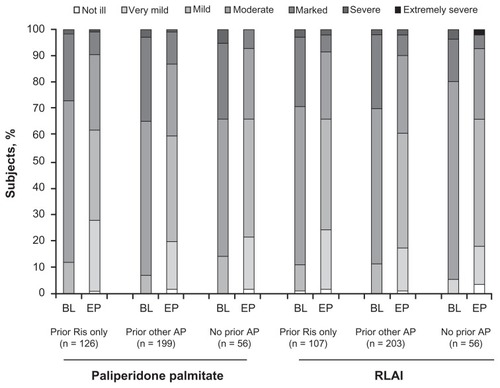
Table 3 Efficacy outcomes
Figure 2 Categorical PSP scale score from baseline to end point.
Abbreviations: AP, antipsychotic; BL, baseline; PSP, Personal and Social Performance; EP, end point; Ris, risperidone; RLAI, risperidone long-acting injectable.
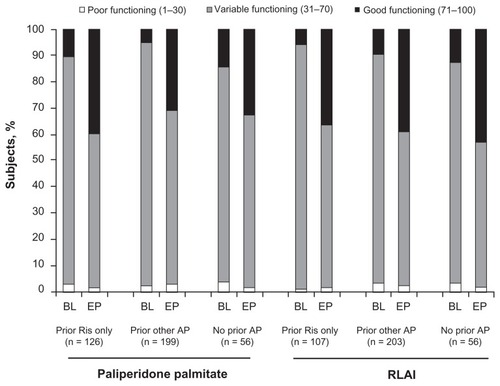
Table 4 Treatment-emergent adverse events