Figures & data
Table 1 Baseline data of all patients and groups according to the type of immunomodulatory treatment (IMT)
Figure 1 Distribution of EDSS score at baseline in groups with different immunomodulatory agents.
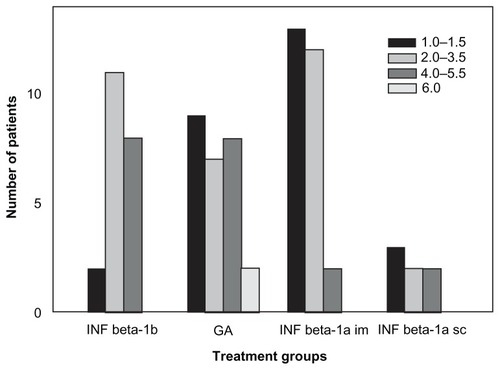
Figure 2 Effect of treatment on relapse numbers in the groups according to the type of immunomodulatory treatment (IMT).
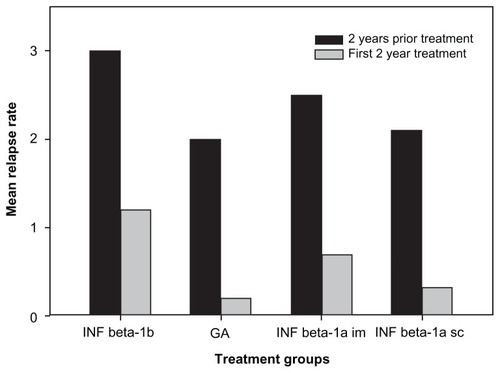
Table 2 Effect of treatment on EDSS progression in patient subgroups according to the length of continuous immunomodulatory treatment (IMT)
Figure 3 Sustained efficacy of longer than 6 years’ immunomodulatory treatment on disability.
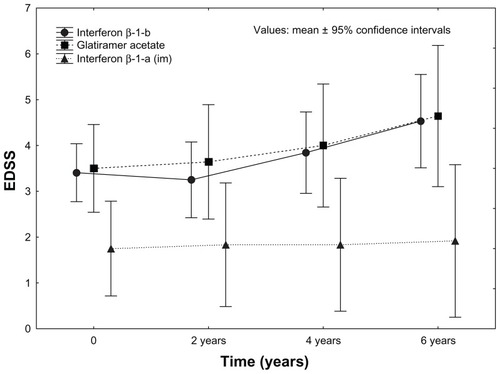
Table 3 Baseline data of patients and treatment response in the groups according to clinical presentation at onset of multiple sclerosis (MS)
Table 4 Long-term effect of immunomodulatory treatment (IMT) on EDSS change in the groups according to short-term response to IMT by relapse numbers
Table 5 Incidences of side effects of immunomodulatory drugs