Figures & data
Table 1 Effect of subchronic treatment with T3 (for 7 days) on baseline concentrations of serotonin, norepinephrine, and dopamine in the medial prefrontal cortex and the amygdale
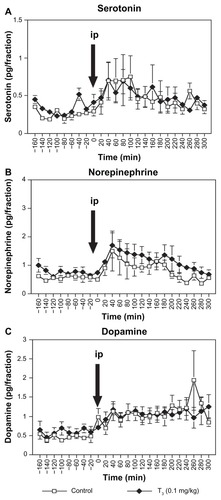
Figure 1 Effect of acute intraperitoneal administration of milnacipran 10 mg/kg on extracellular concentrations of serotonin (A), norepinephrine (B), and dopamine (C) in the medial prefrontal cortex after subchronic treatment with T3 0.1 mg/kg.
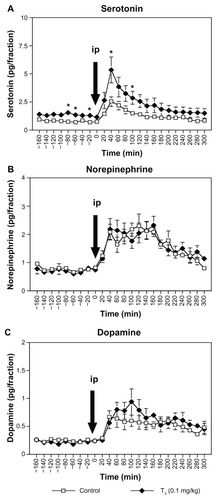
Figure 2 Effect of acute intraperitoneal administration of milnacipran 10 mg/kg on extracellular concentrations of serotonin (A), norepinephrine (B), and dopamine (C) in the medial prefrontal cortex after subchronic treatment with T3 0.2 mg/kg.
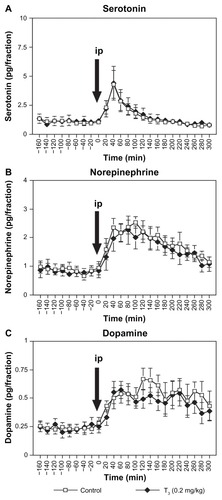
Figure 3 Effect of acute intraperitoneal administration of milnacipran 10 mg/kg on extracellular concentrations of serotonin (A), norepinephrine (B), and dopamine (C) in the amygdala after subchronic treatment with T3 0.1 mg/kg.