
Figures & data
Figure 1 Flow Diagram of the Selection of Study Participants.
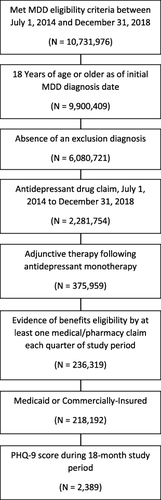
Table 1 Demographic Characteristics and Comorbidities Among Eligible Participants with MDD and ≥PHQ-9 Score During the 18-Month Study Period
Table 2 Baseline and Lowest Follow-Up PHQ-9 Scores Following Adjunctive Therapy Among the 721 Individuals with Scores in Both Periods
Figure 2 Distribution of the Lowest Severity Level Achievedǂ after at least One Month on Adjunctive Therapy, by the Type of Adjunctive Therapy Initiated.ǂSeverity defined by categorized PHQ-9 score: 0 to 4 (none/minimal disease); 5–9 (mild), 10–14 (moderate), 15–19 (moderately severe), and 20–27 (severe).
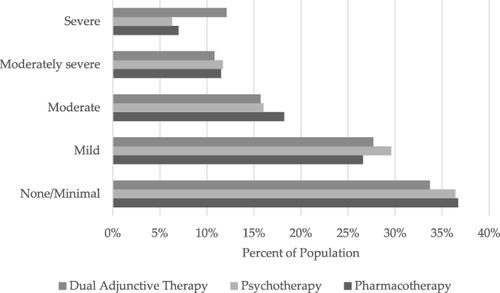
Table 3 HEDIS Performance Among Individuals with a Baseline PHQ-9 Score of 10+