Figures & data
Table 1 Study participants
Table 2 Video clips used to elicit emotions
Table 3 Post film questionnaire
Figure 1 Mean number of concordant responses in obsessive-compulsive disorder, schizophrenia, and control groups.
Abbreviations: OCD, obsessive-compulsive disorder; SCZ, schizophrenia.
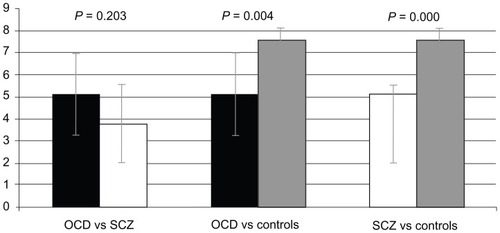
Figure 2 Mean number of discordant responses in obsessive-compulsive disorder, schizophrenia, and control groups.
Abbreviations: OCD, obsessive-compulsive disorder; SCZ, schizophrenia.
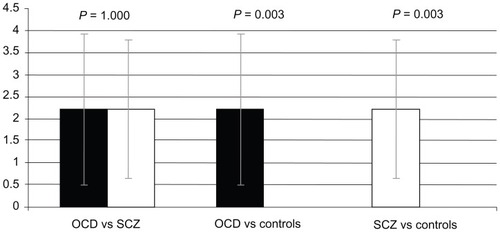
Figure 3 Mean FACS scores in obsessive-compulsive disorder, schizophrenia and control groups.
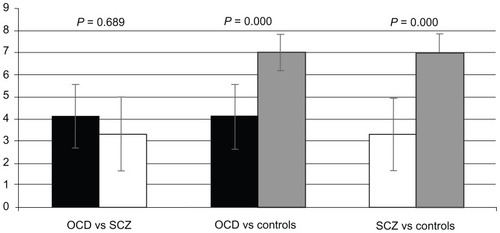
Table 4 Correlation between Y-BOCS scores, FACS scores and post film questionnaire in patients with obsessive-compulsive disorder
Table 5 Correlation between PANSS scores, FACS scores, and post film questionnaire in schizophrenia patients
Table 6 Correlation between BPRS scores, FACS scores, and post film questionnaire