Figures & data
Table 1 Primer Sequences Used in This Study for PCR
Figure 1 The mRNA expression levels of miR-210, TLR4, NF-κB1 and caspase-3 in the hippocampus was measured by qPCR. (A) miR-210 levels increased in the hippocampus of rats after SE. (B) TLR4 levels increased in the hippocampus of rats after SE. (C) NF-κB1 levels increased in the hippocampus of rats after SE. (D) Caspase-3 levels increased in the hippocampus of rats after SE.***p < 0.001, **p < 0.01, *p < 0.05.
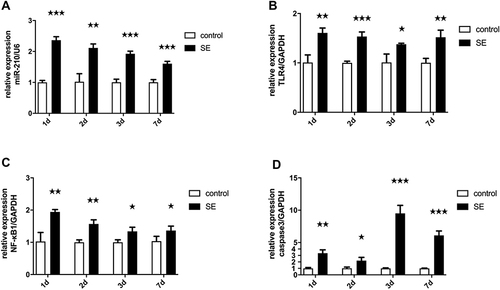
Figure 2 The expression of miR-210 in the hippocampus after microinjection of a miR-210 inhibitor. ***p < 0.001.
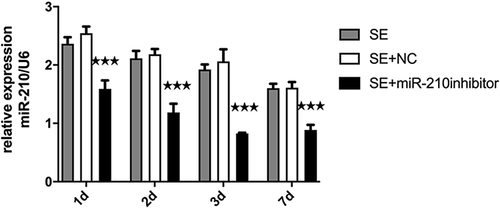
Figure 3 qPCR and Western blot detected the expression of TLR4, NF-κB1 and caspase-3 in the hippocampus after knockdown of miR-210. (A) TLR4 expression increased in the hippocampus after microinjection of a miR-210 inhibitor. (B) NF-κB1 expression increased in the hippocampus after microinjection of a miR-210 inhibitor. (C) Caspase-3 expression increased in the hippocampus after microinjection of a miR-210 inhibitor. (D) Western blot detected the expression changes of TLR4, NF-κB1 and caspase-3 in the hippocampus after microinjection of a miR-210 inhibitor at 7 days. *p < 0.05 and **p < 0.01 compared with the SE + NC group.
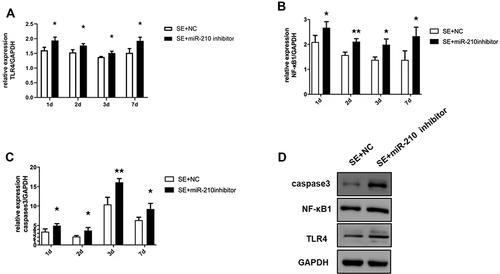
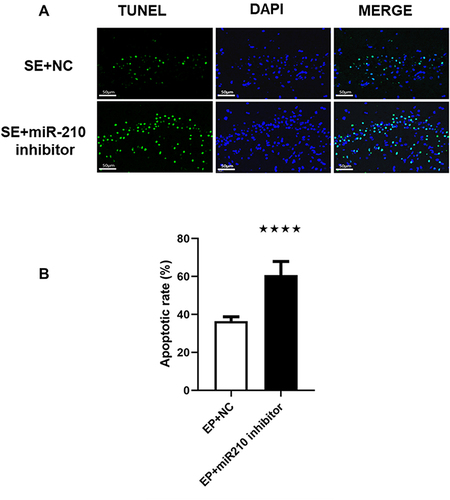
Figure 4 Knockdown of miR-210 improved epilepsy-induced neuronal apoptosis. (A) Hippocampal apoptosis detected through the TUNEL assay after microinjection of a miR-210 inhibitor at 7 days. Image enhanced at 400x magnification. (B) Quantitative results related to apoptosis. ****p < 0.0001 compared with the EP + NC group.