Figures & data
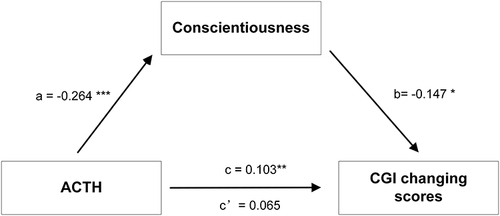
Figure 1 Flow chart of the study design.
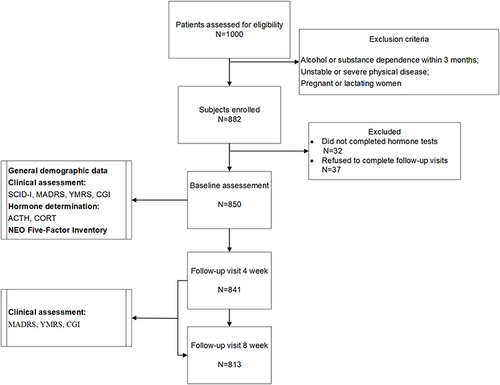
Table 1 Demographic Characteristics, Clinical Features, and HPA Axis of Patients with BD at Baseline (N= 813)
Table 2 The Independent Correlates of HPA According to the Multiple Linear Regression (N=170)
Figure 2 K-means subtyping via dynamic time warping (DTW) algorithm.
Notes: Green means manic symptom trajectory cluster 1; golden represents manic symptom trajectory cluster 2.
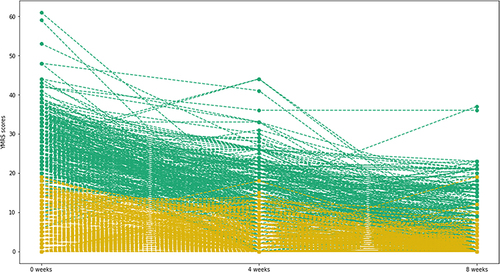
Figure 3 Symptom profiles of the two clusters.
Notes: **p ≤ 0.01, ***p ≤ 0.001; green means cluster 1; golden represents cluster 2.
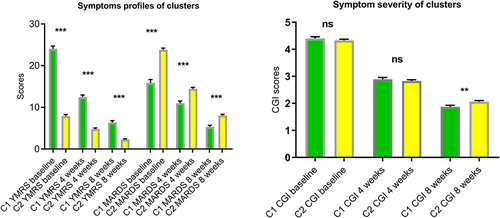
Figure 4 Mediation effects of personality on the relationship between ACTH levels and symptoms (N = 170).
Notes: *P<0.05, **P<0.01, ***P<0.001. The ACTH – Conscientiousness – CGI changing scores mediation model showed good model fit index: CMIN/DF=5.843, p=0.001; RMSEA=0.169. ACTH was negatively related to conscientiousness (βa=−0.264, p<0.001). In turn, conscientiousness was negatively related to CGI changing scores (βb=−0.147, p=0.041). Indirect effect of ACTH on therapeutic efficacy measured by CGI changing scores through conscientiousness (ab)= 0.039, direct effect (c’) = 0.065 (p=0.411), total effect (c) = 0.103 (p=0.001).