
Figures & data
Table 1 Data Extraction of Eligible Studies Included in the Meta-Analysis
Table 2 Stratification of Studies by Ethnicity, PCR Methods, Total Stars and Deductions Based on the Rewritten NOS
Figure 1 A flow diagram of the study selection process.
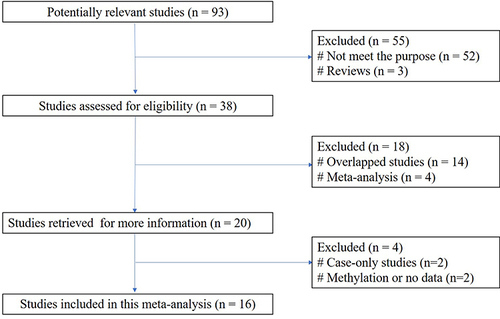
Figure 2 Forest plot of overall studies. (A) Analysis of null genotype vs present genotype of GSTM1. P = 0.25 [Overall OR = 1.11, 95% CI = (0.93–1.32)]. (B) Analysis of null genotype vs present genotype of GSTT1. P = 0.32 [Overall OR = 0.90, 95% CI = (0.73–1.11)]. (C) Analysis of null genotype vs present genotype of GSTM1 + GSTT1. P = 0.46 [Overall OR = 1.16, 95% CI = (0.79–1.69)].
![Figure 2 Forest plot of overall studies. (A) Analysis of null genotype vs present genotype of GSTM1. P = 0.25 [Overall OR = 1.11, 95% CI = (0.93–1.32)]. (B) Analysis of null genotype vs present genotype of GSTT1. P = 0.32 [Overall OR = 0.90, 95% CI = (0.73–1.11)]. (C) Analysis of null genotype vs present genotype of GSTM1 + GSTT1. P = 0.46 [Overall OR = 1.16, 95% CI = (0.79–1.69)].](/cms/asset/5a531333-5be4-4a74-89d8-2f9b462a61fd/dndt_a_12154701_f0002_c.jpg)
Table 3 Overall Analysis and Subgroup Analysis of Ethnicity
Table 4 Overall Analysis and Subgroup Analysis of PCR Methods
Table 5 Overall Analysis and Subgroup Analysis of Stars Obtained from NOS
Table 6 Overall Analysis and Subgroup Analysis of Deductions Assessed Using Rewritten NOS