
Figures & data
Figure 1 Total scores of (A) PDQ-D-5 and (B) PDQ-D-20 at baseline and over the 6 months following initiation of antidepressant medication. Data show the median and interquartile range (IQR) scores at baseline and at 1, 2, and 6 months after the initiation of antidepressant medication. The additional symbol inside the box shows the mean score at each time point. The upper error bar shows (Q3 [max]) at each time point. If outliers are present (shown as symbols above Q3), the upper error bar will be (Q3; Q3 + 1.5 × IQR), where IQR = Q3 − Q1. The lower error bars show (Q1 [min]).
![Figure 1 Total scores of (A) PDQ-D-5 and (B) PDQ-D-20 at baseline and over the 6 months following initiation of antidepressant medication. Data show the median and interquartile range (IQR) scores at baseline and at 1, 2, and 6 months after the initiation of antidepressant medication. The additional symbol inside the box shows the mean score at each time point. The upper error bar shows (Q3 [max]) at each time point. If outliers are present (shown as symbols above Q3), the upper error bar will be (Q3; Q3 + 1.5 × IQR), where IQR = Q3 − Q1. The lower error bars show (Q1 [min]).](/cms/asset/aa695638-8ae4-4076-a611-4a876efa172a/dndt_a_12154050_f0001_c.jpg)
Figure 2 Correlation between the PDQ-D-20 and PDQ-D-5 total scores at baseline and over the 6 months following the initiation of antidepressant medication. Data show PDQ-D-20 total scores against PDQ-D-5 total scores plotted for each patient at (A) baseline, (B) month 1, (C) month 2, and (D) month 6. The correlation coefficients between the PDQ-D-20 and PDQ-D-5 are shown at each time point, where an absolute value > 0.7, 0.4–0.7, or < 0.4 indicates a strong, moderate, or weak correlation, respectively.
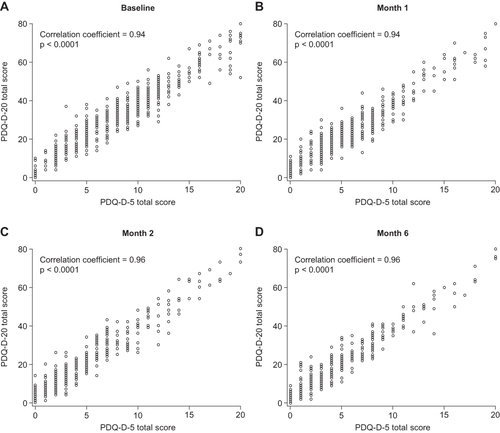
Table 1 Pearson Correlation Coefficients Between WPAI Subscale Scores and PDQ-D-5 Total Scores
Table 2 Correlation Matrices for PDQ-D-5, MADRS, EQ-5D-5L, SDS, DSST, and PHQ-9 Scores