Figures & data
Figure 1 Patient disposition.
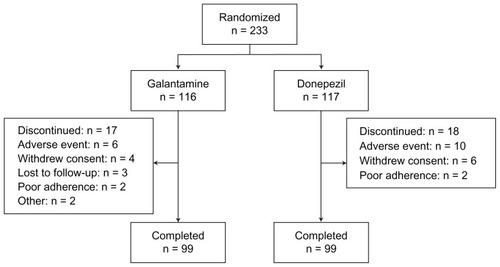
Table 1 Baseline characteristics (FAS)
Figure 2 Mean change from baseline in Alzheimer’s Disease Assessment Scale – cognitive subscale (ADAS-cog/11) score.
Note: *P < 0.05 vs baseline.
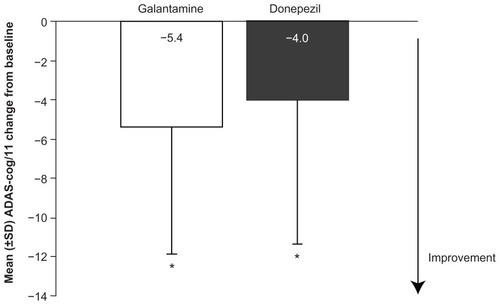
Table 2 Mean scores on the six ADAS-cog/11 functional areas at baseline and week 16
Figure 3 Percentage of patients with an improvement from baseline of >0, >4, >7, and >10 points on the Alzheimer’s Disease Assessment Scale – cognitive subscale (ADAS-cog/11).
Note: *P < 0.05 vs donepezil.
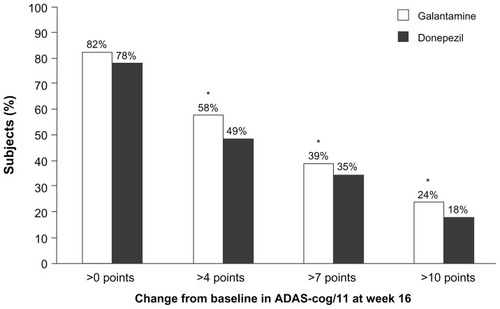
Table 3 Adverse events occurring in ≥3% of subjects in either treatment arm