Figures & data
Figure 1 Study recruitment profile.
Abbreviations: ACS, acute coronary syndrome; PCI, percutaneous coronary intervention.
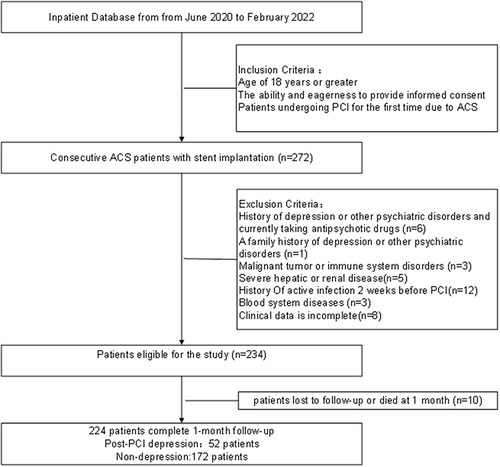
Table 1 Patient Characteristics According to Post-PCI Depressive Symptoms
Table 2 Baseline Characteristics of Post-PCI Patients in NLR Quartiles
Figure 2 The proportion of post-PCI depressive symptoms for the quartiles of NLR at admission.
Abbreviations: NLR, neutrophil to lymphocyte ratio; PCI, percutaneous coronary intervention.
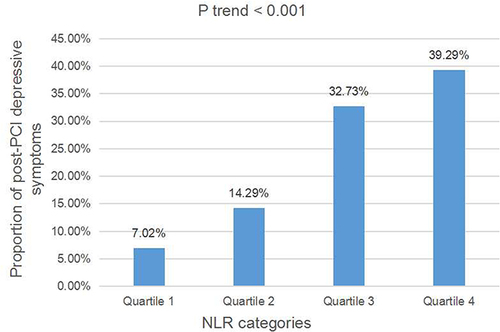
Table 3 Multivariate Adjusted Odds Ratios for the Association Between NLR Levels and Post-PCI Depressive Symptoms
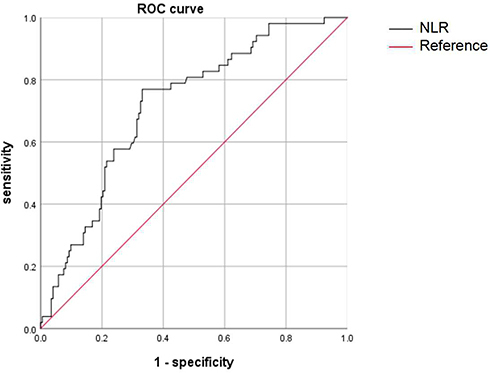
Figure 3 ROC curves for predicting of post-PCI depressive symptoms.
Abbreviations: NLR, neutrophil to lymphocyte ratio; ROC, receiver operating characteristic.