Figures & data
Table 1 HbCO Concentration of Rat Tail-Vein Blood at Each Time Point (%)
Figure 1 Morris water maze experiment (spatial exploration experiment), the red circle in the figure indicates the position of platform. (A) Rats of the control group. (B) DEACMP rats.
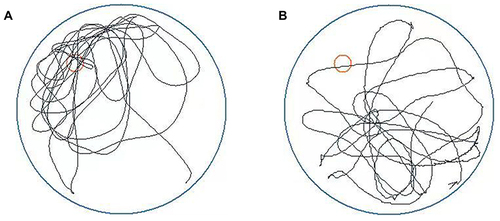
Figure 2 (A) Hippocampus of rats in the control group (HE). (B) Hippocampus of rats in the experimental group (HE).
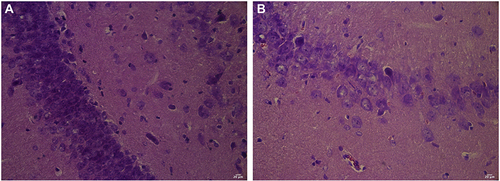
Figure 3 Chromatogram of ATP standard.
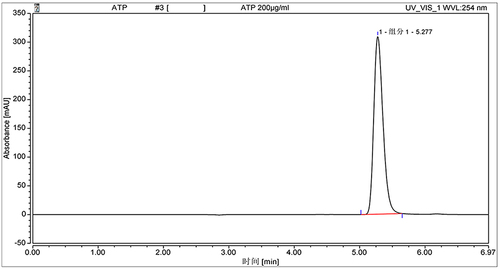
Figure 4 ATP standard curve.
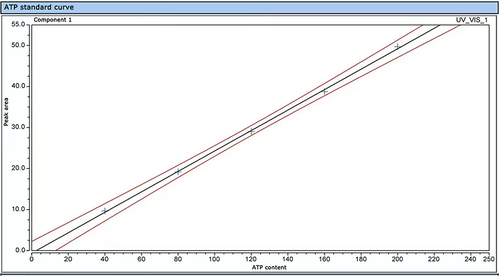
Table 2 ATP Content in Hippocampus of Rats in Different Experimental Groups
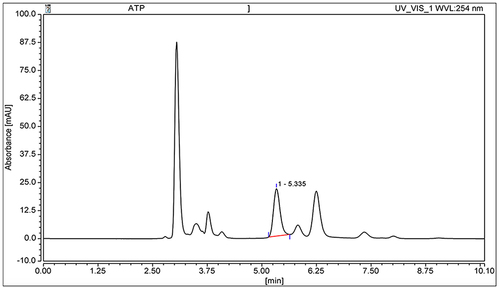
Figure 5 Chromatogram of sample for hippocampus of rats.