Figures & data
Figure 1 Study flow diagram: enrollment to analysis.
Abbreviation: BAT, behavioral activation therapy.
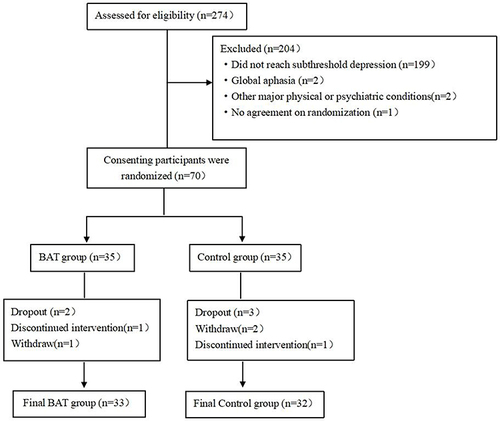
Table 1 Outline of Behavioral Activation Therapy
Table 2 Characteristics of Participants by Group (n = 65)
Table 3 Depression Outcome by Group at 3-Month Follow-Up (n=65)
Table 4 Impact of the Intervention on Outcome Measures at Three Time-Points
Figure 2 CES-D scores for two groups on T1, T2, and T3.
Abbreviations: CES-D, The Center for Epidemiological Studies Depression Scale; T1, baseline; T2, six weeks; T3, three months after the group allocation.
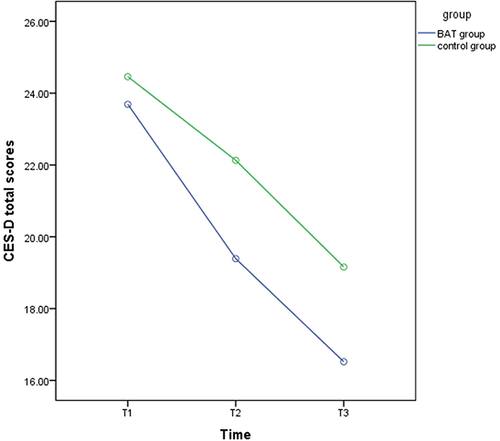
Figure 3 HAMD-17 scores for two groups on T1, T2, and T3.
Abbreviations: HAMD-17, 17-item Hamilton Depression Scale; T1, baseline; T2, six weeks; T3, three months after the group allocation.
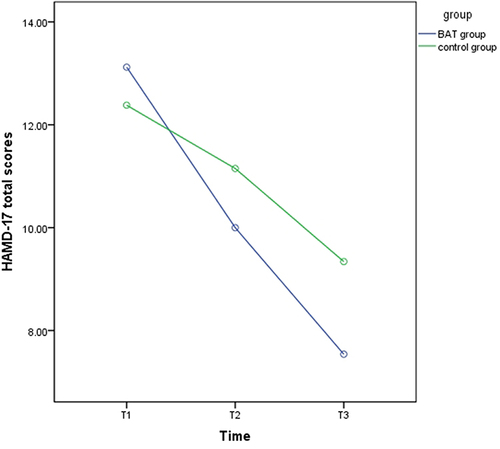
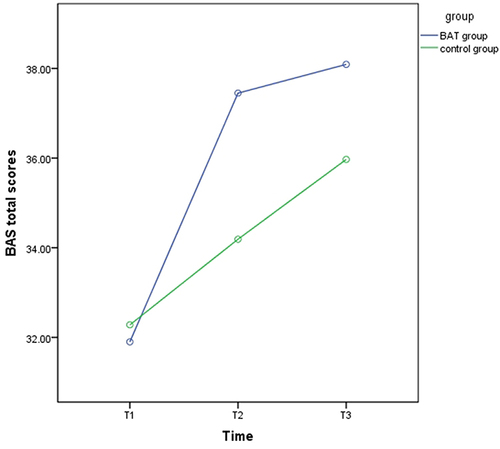
Figure 4 BAS scores for two groups on T1, T2, and T3.
Abbreviations: BAS, Behavioral Activation System Scales; T1, baseline; T2, six weeks; T3, three months after the group allocation.