Figures & data
Table 1 Demographic and migraine history characteristics of the 28 patients at baseline
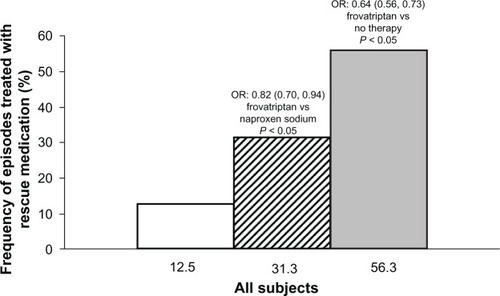
Figure 1 Average score (and 95% confidence interval) of migraine severity in all subjects and in those not taking rescue medication.
Notes: Data are shown for frovatriptan (open bars), naproxen sodium (dashed bars), and no therapy periods (full bars). P values of between-treatment differences are reported: *P < 0.05 frovatriptan versus naproxen sodium; **P < 0.001 frovatriptan versus no therapy; ***P < 0.001 frovatriptan versus naproxen sodium or versus no therapy; ##P < 0.001 naproxen sodium versus no therapy.
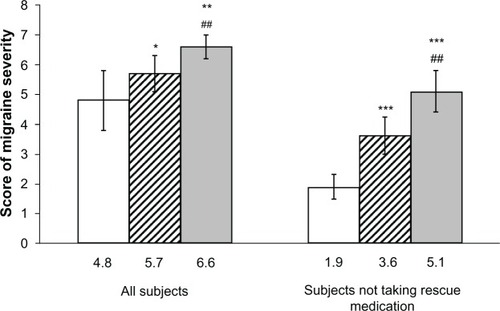
Figure 2 Average score (and 95% confidence interval) of migraine severity in subjects not taking rescue medication, according to weekend day.
Notes: Data are shown for frovatriptan (open bars), naproxen sodium (dashed bars), and no therapy periods (full bars). P values of between-treatment differences are reported: *P , 0.05 frovatriptan versus naproxen sodium; **P , 0.001 frovatriptan versus naproxen sodium; ***P , 0.001 frovatriptan versus no therapy.
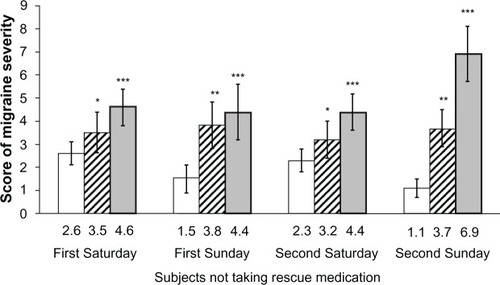
Figure 3 Frequency (%) of episodes treated with rescue medication during treatment with frovatriptan (open bar), naproxen sodium (dashed bar) or during no therapy (full bar).
Note: Corresponding odds ratio (OR), 95% confidence intervals and P values of frovatriptan versus comparators are reported on top of each bar.