Figures & data
Figure 1 Headband used on patients' heads for the Brain4care non-invasive ICP measuring device.
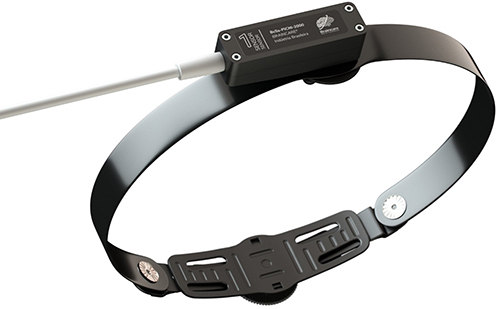
Figure 2 Band connected to Brain4care's non-invasive ICP measuring device.
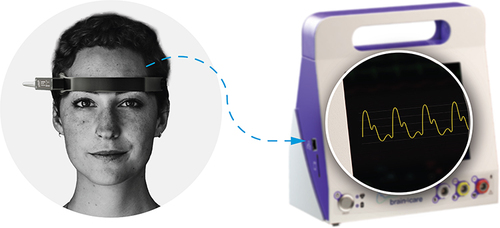
Table 1 Clinical Background of Patients
Table 2 P-value of the Variable P2/P1 in the Inconclusive Tap Test in Each Position
Table 3 Statistics of the Variable P2/P1 in the Inconclusive Tap Test for Each Moment According to Position
Figure 3 Comparison of the P2/P1 variable in relation to the inconclusive tap test before and after the puncture.
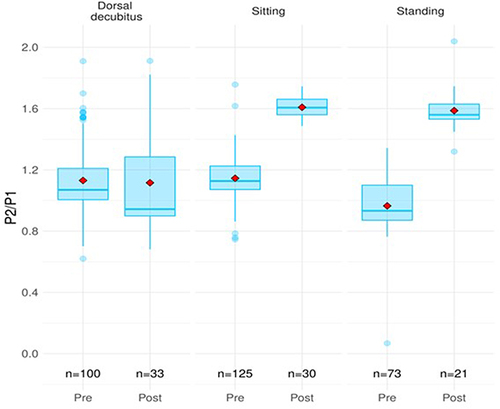
Table 4 P-value of the TTP Variable in the Inconclusive Tap Test in Each Position
Table 5 Statistics of the TTP Variable in the Inconclusive Tap Test for Each Moment According to Position
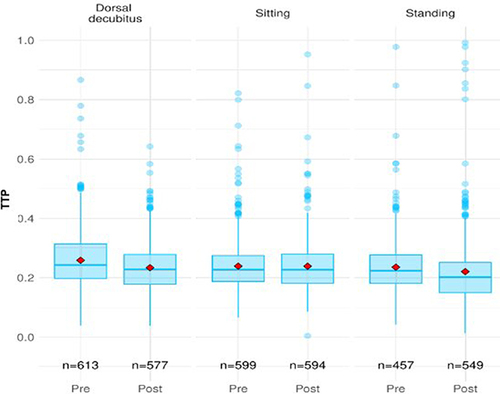
Figure 4 Comparison of the TTP variable in relation to the inconclusive tap test before and after the puncture.
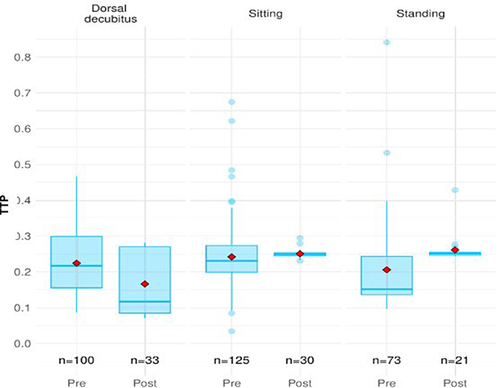
Table 6 P-value of the Variable P2/P1 in the Negative Tap Test in Each Position
Table 7 Statistics of the P2/P1 Variable in the Negative Tap Test for Each Moment According to Position
Figure 5 Comparison of the P2/P1 variable in relation to the negative tap test before and after the puncture.
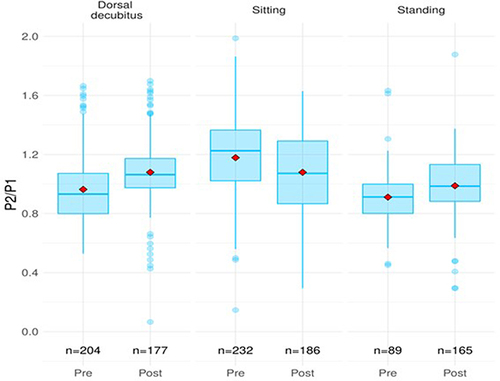
Table 8 P-value of the TTP Variable in the Negative Tap Test in Each Position
Table 9 Statistics of the TTP Variable in the Negative Tap Test for Each Moment According to Position
Figure 6 Comparison of the TTP variable in relation to the negative tap test before and after the puncture.
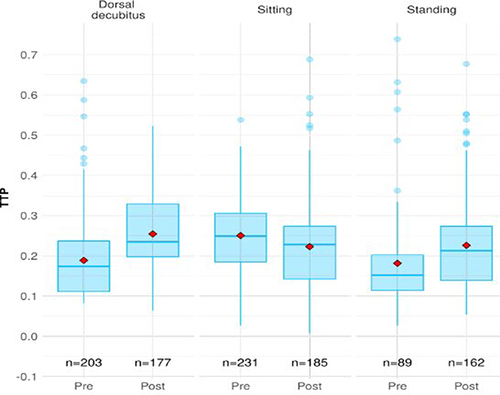
Table 10 P-value of the Variable P2/P1 in the Tap Test Positive in Each Position
Table 11 Statistics of the P2/P1 Variable in the Positive Tap Test for Each Moment According to Position
Figure 7 Comparison of the P2/P1 variable in relation to the positive tap test before and after the puncture.
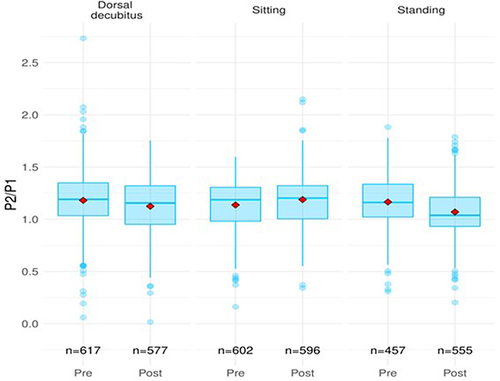
Table 12 P-value of the Variable P2/P1 in the PositiveTap Test in Each Position
Table 13 Statistics of the TTP Variable in the Positive Tap Test for Each Moment According to Position
Figure 8 Comparison of the TTP variable in relation to the positive tap test before and after the puncture.