Figures & data
Figure 1 Flow chart.
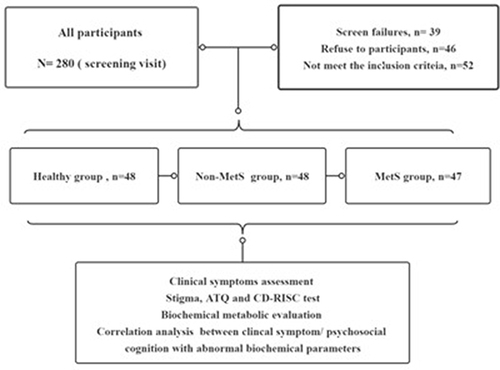
Table 1 General Demographic Background, Blood Routine, and Biochemical Indicators Among the Three Groups
Table 2 Comparison of Resilience, Automatic Thoughts and Stigma Among Three Groups
Table 3 Correlation Analysis Among Clinical Symptoms and Resilience, Stigma and Automatic Thinking
Table 4 Correlation Analysis Among Biochemical Parameters with Stigma, Resilience and Automatic Thoughts
Table 5 Stepwise Linear Regression Analysis of Stigma, CD-RISC and Automatic Thinking
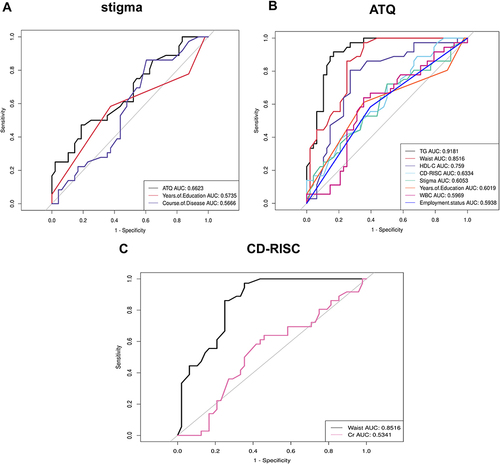
Figure 2 ROC curve analysis was used to predict the psychological structure impairment of MetS groups by using dysbiosis of MetS parameters and demographic and clinical characteristics. (A) Independent risk factors used to predict stigma; (B) Independent risk factors used to predict ATQ; (C) lndependent risk factors used to predict CD-RISC.