
Figures & data
Figure 1 Subject flow chart of the present study.
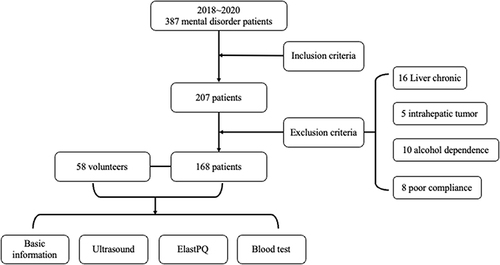
Figure 2 Schematic diagram of sonographic features for fatty liver diagnosis.
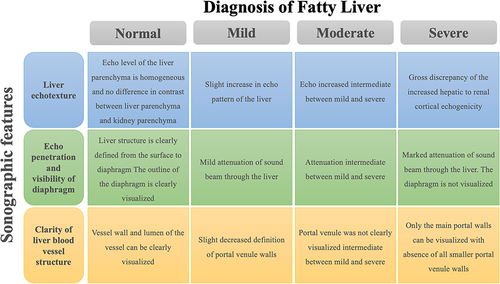
Table 1 Characteristics of the Study Population
Table 2 The Stiffness Value Using ElsatPQ in Different Stages of Fatty Liver
Figure 3 Box plot of the ElastPQ values in different fatty liver degrees. In the normal liver, the stiffness value obtained by ElastPQ was 3.48(3.14–3.81) kPa, whereas it was 3.39(3.07–3.67) kPa in the patients and 3.25(3.31–4.01) kPa in the control, respectively. For mild fatty liver, the stiffness value was 4.45(4.14–4.81) kPa, 4.35(4.21–4.62) kPa in the patients, and 4.33(3.82–4.58) kPa in the control, respectively. For moderate fatty liver, the stiffness value was 5.82(5.13–6.11) kPa, while 5.53(5.82–6.78) kPa in the patients and 5.37(4.91–5.78) kPa in the control, respectively. The liver stiffness value was 8.15(6.44–9.88) in the severe fatty liver, whereas 8.50(7.08–10.93) kPa in the patients and 6.6(6.1–8.1) kPa in the control, respectively. The blue bar represents the values in the patients, and the red bar represents the values in the control.
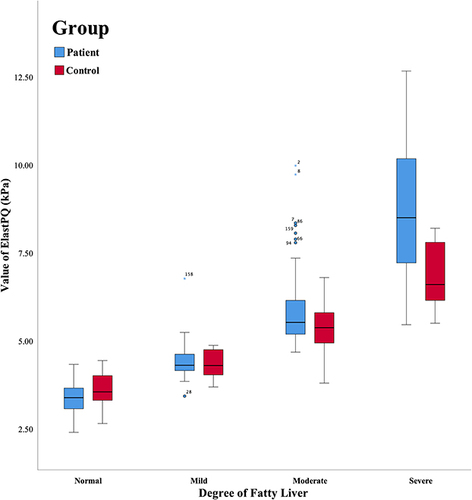
Table 3 The AUC, Cut-off Value, Sensitivity, and Specificity for the Diagnosis of Fatty Liver Grade
Figure 4 The receiver operating characteristic curves for ElastPQ values used for the detection and differentiation of fatty liver grades.
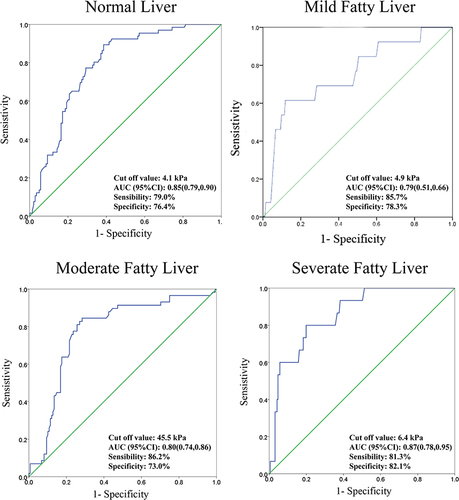
Table 4 The Result of ElastPQ and Fatty Liver in Different Types of AAPs
Table 5 The Variation of ElastPQ in Different Treatment Time