Figures & data
Table 1 Demographic and Clinical Characteristics of ADHD
Table 2 WISC-IV Subtest and Index Scores in 146 Children with ADHD
Figure 1 The cognitive profiles in ADHD with and without comorbid symptoms. Estimated mean scores of WISC-IV indexes for children with ADHD alone (n = 55) and with comorbid symptoms (n = 91). Error bars represent standard errors.
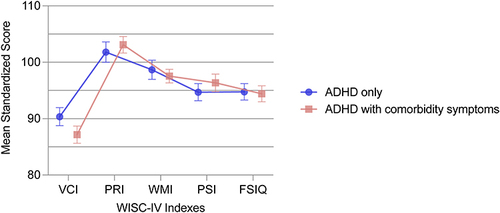
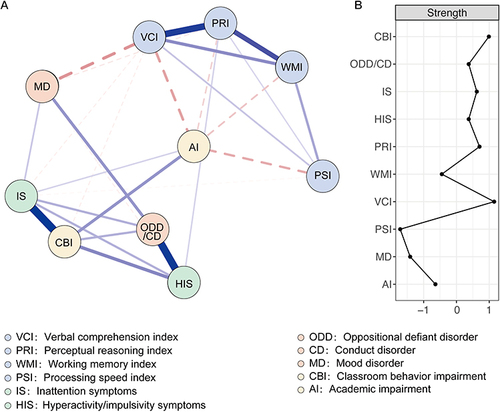
Figure 2 The ADHD-Cognition network based on the parent ratings and the corresponding strength centrality indices. (A) The ADHD-Cognition network based on the parent ratings of the children with ADHD. The nodes in the network represent ADHD symptoms and cognitive profiles, and the edges represent strength of association between nodes. Blue edges and red edges represent positive and negative correlations, respectively, and thicker edges represent higher correlations. (B) The strength centrality of each node in the ADHD-Cognition network based on the parent ratings. Nodes are depicted on the y-axis and Values shown on the x-axis are standardized z-scores. Node strength signifies to the number and strength of the direct associations of a node with other nodes in the network.
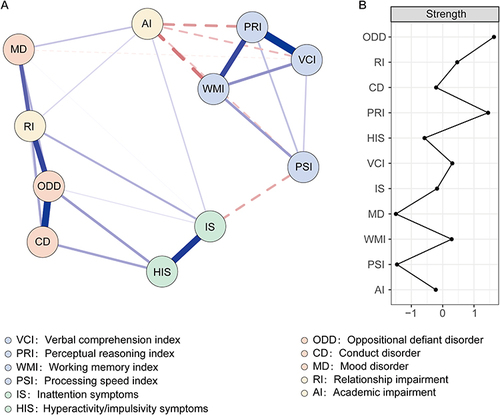
Figure 3 The ADHD-Cognition network based on the teacher ratings and the corresponding strength centrality indices. (A) The ADHD-Cognition network based on the teacher ratings of the children with ADHD. The nodes in the network represent ADHD symptoms and cognitive profiles, and the edges represent strength of association between nodes. Blue edges and red edges represent positive and negative correlations, respectively, and thicker edges represent higher correlations. (B) The strength centrality of each node in the ADHD-Cognition network based on the teacher ratings. Nodes are depicted on the y-axis and Values shown on the x-axis are standardized z-scores. Node strength signifies to the number and strength of the direct associations of a node with other nodes in the network.