Figures & data
Table 1 Demographics and Clinical Parameters of Patients in Primary and Validation Cohort
Figure 1 Flow Chart.
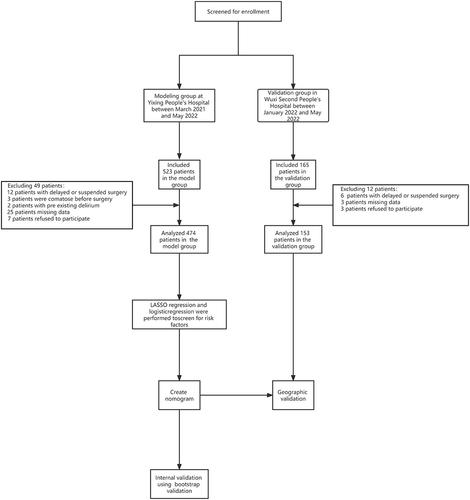
Figure 2 Selection of risk factors for POD using the LASSO binary logistic regression model.
Notes: (A) The LASSO model’s optimal parameters (lambda) were selected using five-fold cross-validation with the minimum criteria. The logarithm of the partial likelihood deviation (binomial deviation) curves was shown. Using the minimal criteria and its one standard error, dashed vertical lines are displayed at the optimal values (1-SE criterion). (B) Profiles of the lasso coefficients for 46 characteristics. log(λ) sequences were used to plot coefficient profiles. The optimum lambda produces six features with non-zero coefficients, which are represented as vertical lines at values chosen using five-fold cross-validation.
Abbreviations: LASSO, least absolute shrinkage and selection operator; SE, standard error.
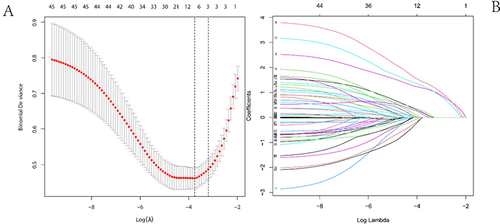
Table 2 Predictive factors for POD
Figure 3 Developed POD nomogram.
Notes: Creating a nomogram that predicts the likelihood that older patients undergoing elective orthopedic surgery would experience POD, taking into account factors including age, MMSE, sleep disorder, Neurological disorders, Pre-Scr, and ASA classification.
Abbreviations: Scr, serum creatine; ASA, American Society of Anesthesiologists.
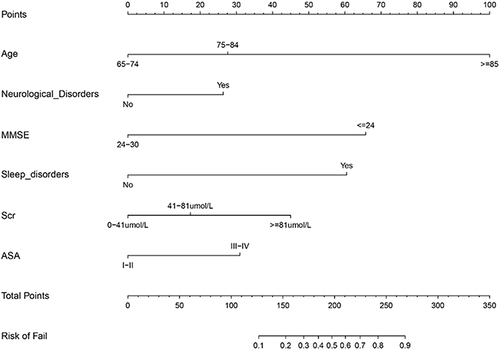
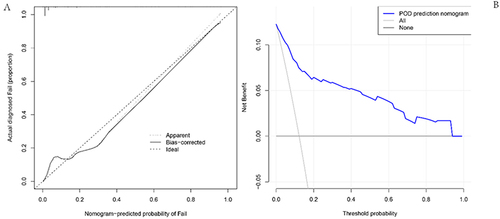
Figure 4 Calibration curves and decision curve analysis for the POD nomogram.
Notes: (A) The x-axis indicates the predicted POD risk. The y-axis indicates the inconsistency of the actual diagnosis. Ideal indicates the correction curve of the perfect prediction model. Apparent indicates the performance of the training set. Bias-corrected indicates the performance of the model after repeated self-sampling, where closer to the diagonal dashed line indicates better prediction. (B) The horizontal coordinate of the graph is the Threshold Probability. The vertical coordinate is the net benefit after subtracting the disadvantage from the benefit.