Figures & data
Table 1 Comparison of Sociodemographic and Laboratory Variables Among Schizophrenia, BD and Healthy Controls
Table 2 Comparison of Sociodemographic and Laboratory Variables Among BD-Depression, BD-Manic and Healthy Controls
Table 3 Comparison of Sociodemographic and Laboratory Variables Among BD-D, BD-M and SCZ
Table 4 The Potential Predictive Values of Albumin-Based Markers in Logistic Regression Between the Control Group and the Acute Disease Status Group
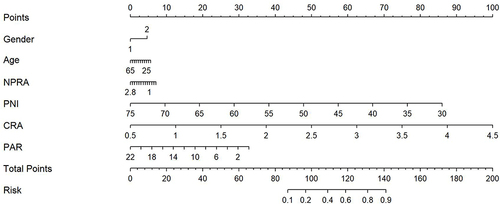
Figure 1 Risk factors of SCZ nomogram. (Code of sex, 1: male, 2: female) (To use the nomogram, an individual patient’s value is located on each variable axis, and a line is drawn upward to determine the number of points received for each variable value. The sum of these numbers is located on the Total Points axis, and a line is drawn downward to the Risk of SCZ axes to determine the SCZ risk).
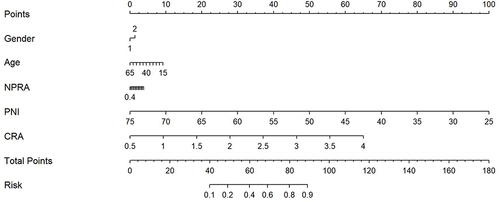
Figure 2 Risk factors of BD nomogram. (Code of sex, 1: male, 2: female) (To use the nomogram, an individual patient’s value is located on each variable axis, and a line is drawn upward to determine the number of points received for each variable value. The sum of these numbers is located on the Total Points axis, and a line is drawn downward to the Risk of BD axes to determine the BD risk).
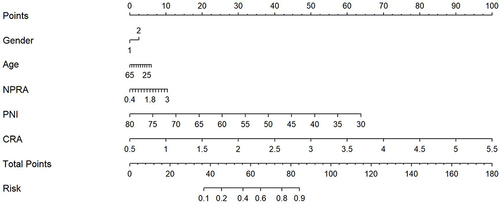
Figure 3 Risk factors of BD-M nomogram. (Code of sex, 1: male, 2: female) (To use the nomogram, an individual patient’s value is located on each variable axis, and a line is drawn upward to determine the number of points received for each variable value. The sum of these numbers is located on the Total Points axis, and a line is drawn downward to the Risk of BD-M axes to determine the BD-M risk).
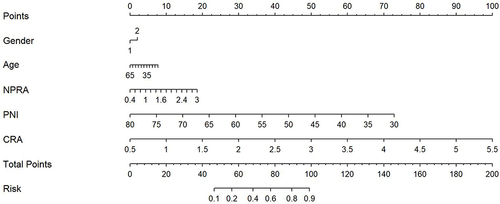
Figure 4 Risk factors of BD-D nomogram. (Code of sex, 1: male, 2: female) (To use the nomogram, an individual patient’s value is located on each variable axis, and a line is drawn upward to determine the number of points received for each variable value. The sum of these numbers is located on the Total Points axis, and a line is drawn downward to the Risk of BD-D axes to determine the BD-D risk).