Figures & data
Table 1 Study design
Figure 1 Flowchart of participants.
Abbreviations: n, number; VR, vestibular rehabilitation; GI, gastrointestinal.
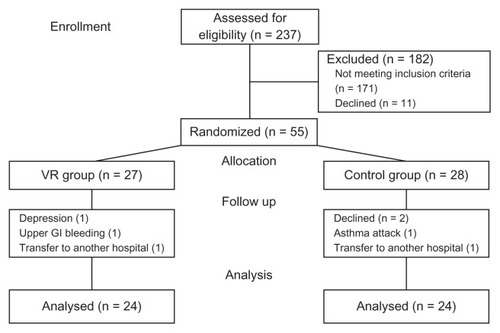
Table 2 Summary of sample characteristics
Table 3 Comparison of the VR and the control groups in the outcome measures
Table 4 GEE model evaluation of comparison between groups and times