Figures & data
Figure 1 Sketch of the 2-door task: Participants are required to select one of the two identical doors displayed on the screen within 5000ms. Following a 3000ms wait time with a fixation at the center of the screen, feedback indicating either a monetary win or loss will be presented for 2000ms. The inter-trial interval (ITI) is set at 1000ms.
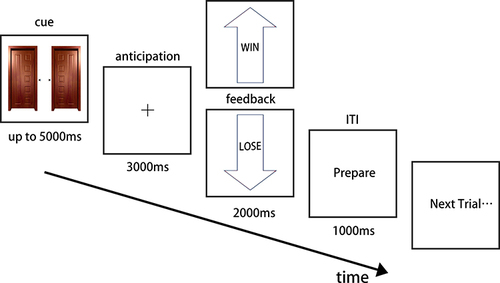
Table 1 Demographic Characteristics and Clinical Information of Two Groups
Figure 2 (a) Grand averaged ERPs of the win condition in the HC group (solid green line), lose condition in the HC group (solid red line), win condition in the MDD group (dashed green line), and lose condition in the MDD group (dashed red line); the difference wave of the lose condition minus the win condition in the HC group (solid blue line) and in the MDD group (dashed blue line). The time window corresponding to FRN is indicated by the pink shaded area. (b) A topography map depicting the grand average amplitude of the difference wave within the 250ms-350ms timeframe for the HC group (upper) and the MDD group (lower). Electrodes of interest (F1, Fz, F2, FC1, FCz, FC2) are marked as red points.
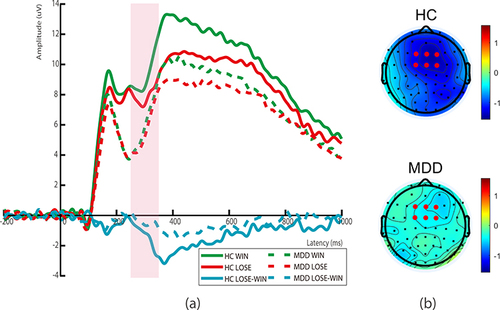
Figure 3 (a) Grand averaged ERPs preceding feedbacks following the win condition in the HC group (solid green line) and MDD group (dashed green line), and the lose condition in the HC group (solid red line) and MDD group (dashed red line). The SPN time window is highlighted using a pink shadow. (b) Topography map of the grand average amplitude of SPN within its timeframe for HC group (up) and MDD group (down). The electrodes of interest (F2, FC2) are highlighted as red points.
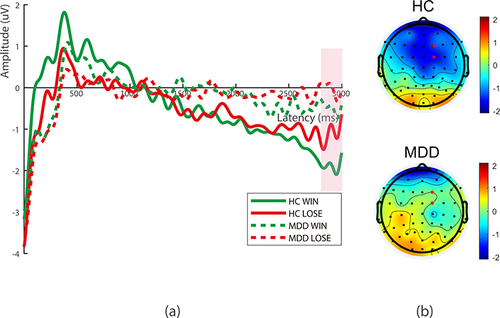
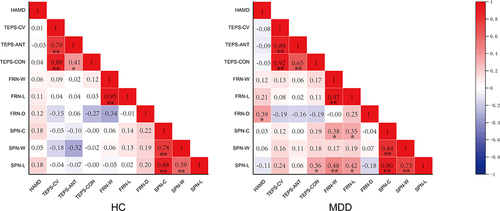
Figure 4 Heat map for correlations among variables in HC (left) and MDD (right) groups. Positive correlations are indicated in red, while negative correlations are marked in blue.