
Figures & data
Table 1 Comparison of Demographic Characteristics Between the DWM Group and the DWOM Group
Figure 1 Comparison of baseline serum indices between DWM group and DWOM group. (A) The comparison of serum BDNF levels. (B) The comparison of serum FGF2 levels. (C) The comparison of serum FGF7 levels. (D) The comparison of serum FGF22 levels.
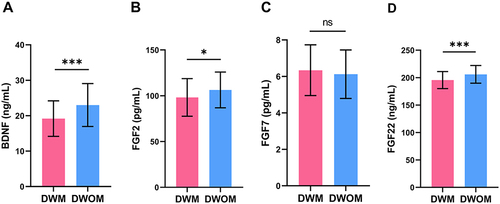
Figure 2 Comparison of baseline ERP indices between DWM group and DWOM group. (A) The comparison of P300 amplitude. (B) The comparison of P300 latency. (C) The comparison of MMN amplitude. (D) The comparison of MMN latency. (E) The comparison of N200 amplitude. (F) The comparison of N200 latency.
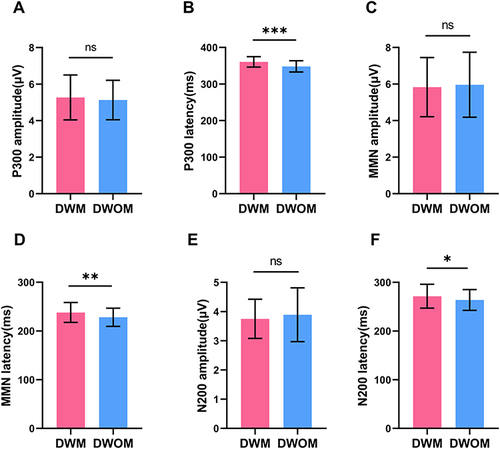
Table 2 Logistic Regression Analysis of Baseline Factors Influencing the Occurrence of MCI
Figure 3 Correlation analysis of the relationships of MoCA scores at the time of MCI diagnosis with serum BDNF and FGF22 levels and the P300 latency in DWM group. (A) Scatterplot of the relationship between MoCA scores at the time of MCI diagnosis and serum BDNF levels. (B) Scatterplot of the relationship between MoCA scores at the time of MCI diagnosis and serum FGF22 levels. (C) Scatterplot of the relationship between MoCA scores at the time of MCI diagnosis and the P300 latency.
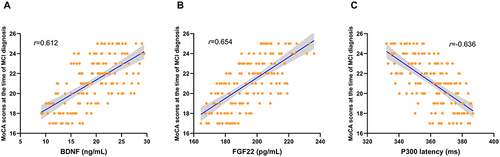
Table 3 Comparison of the Sensitivity, Specificity and AUC of Individual Indices and Combinations of Indices
Figure 4 ROC curves of the detection power of different combinations of serum BDNF and FGF22 levels and the P300 latency. (A) ROC curves of BDNF, FGF22 and P300 latency. (B) ROC curves of BDNF+FGF22, BDNF+P300 latency and FGF22+P300 latency. (C) ROC curves of BDNF+FGF22+P300 latency.
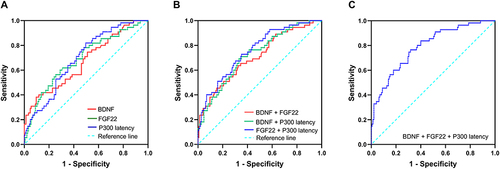
Table 4 Predictive Accuracy of Different Combinations of Indices