
Figures & data
Figure 1 Flow diagram of the study population.
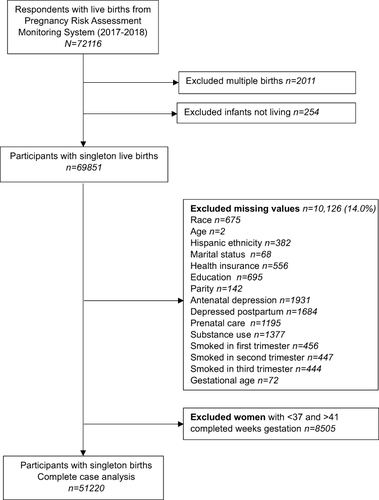
Figure 2 Directed acyclic graph (DAG). Primary exposure (X): smoking patterns; Secondary exposure (W): antenatal depression; Outcome (Y): postpartum depression; Interaction term (XxW): smoking x antenatal depression; Confounding variables: age, race/ethnicity, education, prenatal care, health insurance, and marital status. (U) other measured and unobserved/unmeasured confounders.
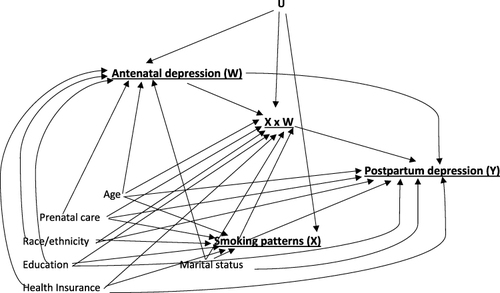
Table 1 Participants with Live Singleton Term Births Who Reported (Cases) and Did Not Report (Controls) Postpartum Depression (Total N = 51220) (Unweighted N, Weighted %)
Table 2 Prevalence of Smoking Patterns During Pregnancy Among Study Participants (Total Smokers N = 3921; 7.7%) (Unweighted N, Weighted %)
Table 3 Multivariable Log Binomial Regression Models for the Main Effects
Table 4 Log-Binomial Regression Model for the Interaction Effects
Table 5 Additive Scale Measures for Interaction