
Figures & data
Table 1 Demographic and Clinical Characteristics of the Participants
Figure 1 (A–D) Four rhythms, Theta (A), Alpha1 (B), Alpha2 (C), Beta (D) PSD values of 16 EEG channels of the AS group and the GAD group respectively. Each value is the average of all subjects. PSD refers to power spectral density.
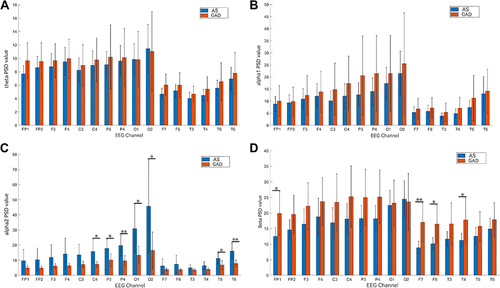
Figure 2 (A–D) Four rhythms, Theta (A), Alpha1 (B), Alpha2 (C), Beta (D) FE values of 16 EEG channels of the AS group and the GAD group respectively. Each value is the average of all subjects. FE refers to fuzzy entropy.
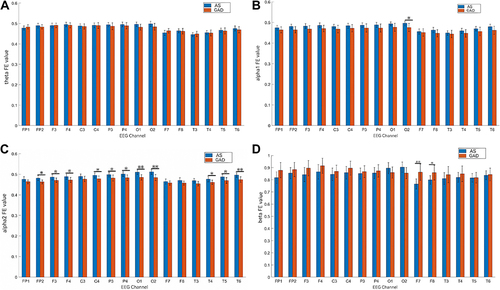
Figure 3 (A–D) Brain functional network of Theta (A), Alpha1 (B), Alpha2 (C), Beta (D) rhythms of 16 EEG channels of the AS group and the GAD group respectively. The line indicates that the PLI between the two channels is significantly different between the two groups. Blue lines indicate that the PLI values of AS group are higher than the GAD group, and red lines indicate that the PLI values of GAD group are higher than the AS group.
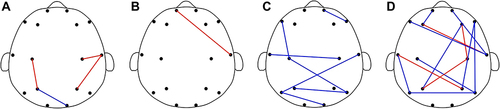
Table 2 Classification Accuracies of Four Machine Learning Approaches
Data Sharing Statement
Data sets generated during the period and/or analyzed in this study can be obtained from the corresponding author upon reasonable request.