Figures & data
Figure 1 Histogram plots for frequency distribution of age at diagnosis in patients with DLB and patients with PDD.
Abbreviations: DLB, dementia with Lewy bodies; PDD, Parkinson’s disease with dementia.
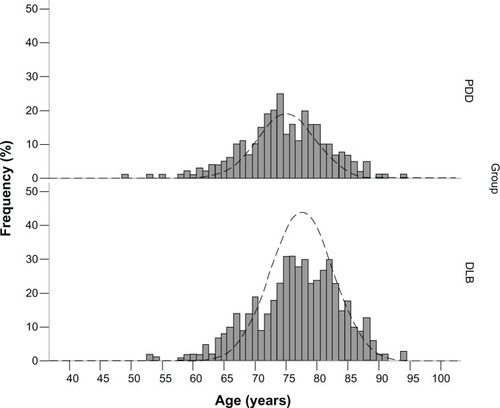
Figure 2 Histogram plots for frequency distribution of MMSE score in patients with DLB and patients with PDD.
Abbreviations: MMSE, Mini-Mental State Examination; DLB, dementia with Lewy bodies; PDD, Parkinson’s disease with dementia.
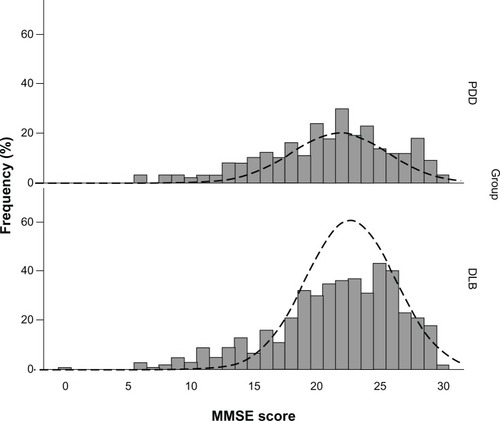
Table 1 Baseline and demographic characteristics of patients suffering from DLB (n = 487) or PDD (n = 297)
Table 2 Comparison of diagnostic and medication characteristics of patients suffering from DLB (n = 487) versus PDD patients (n = 297)
Figure 3 Spearman’s correlation between either patients’ age or dementia severity represented by MMSE score and total number of diagnostic tests.
Notes: (A) Patients with DLB (Spearman rho = −0.292; P < 0.001). (B) Patients with PDD (Spearman rho = −0.264; P < 0.001). (C) Patients with DLB (Spearman rho = +0.167; P < 0.001). (D) Patients with PDD (Spearman rho = +0.131; P = 0.030).
Abbreviations: MMSE, Mini-Mental State Examination; DLB, dementia with Lewy bodies; PDD, Parkinson’s disease with dementia.
Abbreviations: MMSE, Mini-Mental State Examination; DLB, dementia with Lewy bodies; PDD, Parkinson’s disease with dementia.
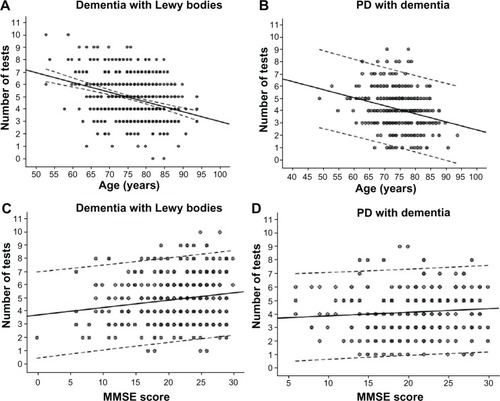
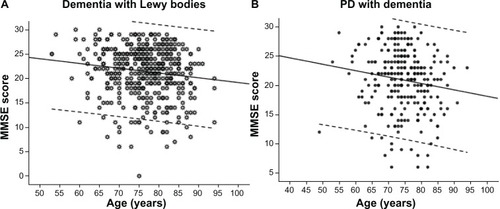
Figure 4 Spearman’s correlation between patients’ age and dementia severity represented by MMSE score.
Notes: (A) Patients with DLB (Spearman rho = −0.127; P = 0.007). (B) Patients with PDD (Spearman rho = −0.173; P = 0.004).
Abbreviations: MMSE, Mini-Mental State Examination; DLB, dementia with Lewy bodies; PDD, Parkinson’s disease with dementia.
Abbreviations: MMSE, Mini-Mental State Examination; DLB, dementia with Lewy bodies; PDD, Parkinson’s disease with dementia.