
Figures & data
Table 1 Baseline Demographics and Clinical Characteristics
Figure 1 Vortioxetine dosing in working patients with major depressive disorder over the 6-month study period (n=424).
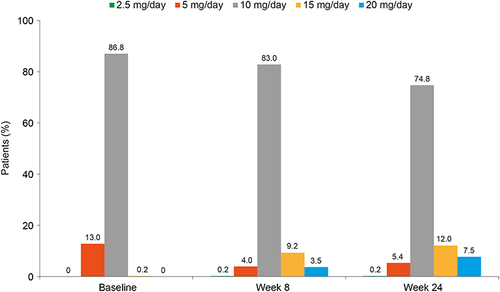
Figure 2 Adjusted mean (SE) change from baseline to weeks 8 and 24 for SDS total and domain scores (mixed-model repeated measures analysis).
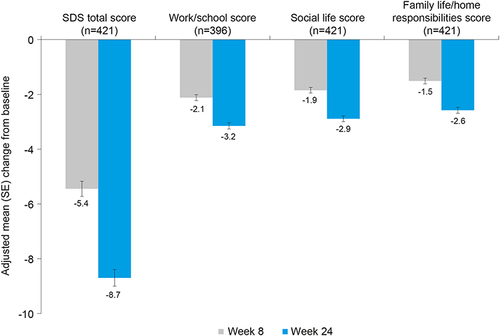
Figure 3 Change in level of functional impairment over time in working patients with MDD treated with vortioxetine.
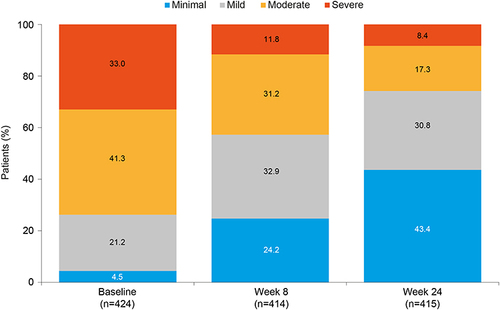
Figure 4 Adjusted mean (SE) change from baseline to weeks 8 and 24 for SDS total score by (A) vortioxetine treatment line and (B) duration of MDD (mixed-model repeated measures analysis).
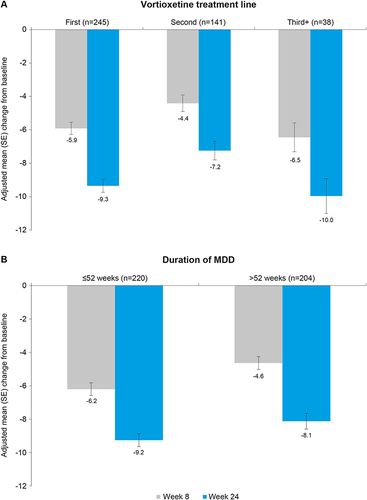
Figure 5 Adjusted mean (SE) change from baseline to weeks 8 and 24 for PHQ-9, HAM-D17, CGI-S, GAD-7, and PDQ-D scores (mixed-model repeated measures analysis).
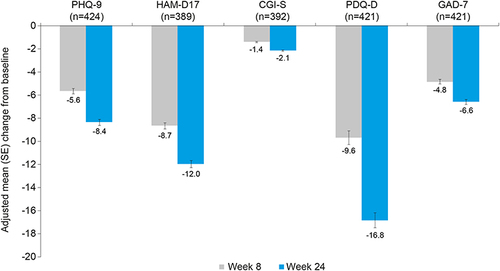
Table 2 Summary of AEs Reported in Adhering Working Patients During the Study
Data Sharing Statement
The authors confirm that the data supporting the findings of this study are available within the article. The authors may be contacted for further data sharing.