Figures & data
Table 1 Comparison of Demographic Variables Between Different Groups
Figure 1 (a) Set A is dominated by proximity organizations; Set B adds a background image around Set A, comparing proximity organizations to make similarity organizations dominant. (b) The task is to determine whether the large and small shapes are triangles or arrows, respectively.
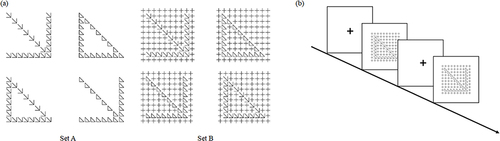
Figure 2 (a) Schematic depiction of the stimulus groups for Experiment 2 and (b) Schematic description of Experiment 2, the no-change pattern was presented in the first display and the no shape change, the non-topological change, or the topological change pattern was presented in the second display randomly.
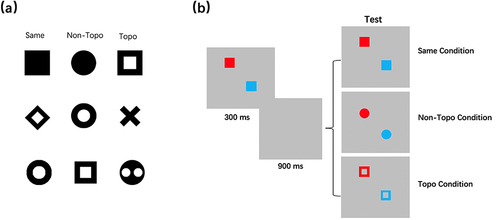
Table 2 RTs of Perceptual Organization Under Different Tasks in Different Groups
Figure 3 Estimated mean values (and standard error) of RTs (in ms) for each group, task, and consistency in the perceptual organization task; (a) Set A is dominated by proximity organizations and (b) Set B is dominated by similarity organizations.
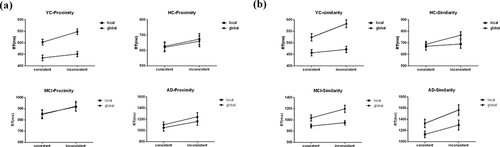
Table 3 Comparison of Visual Working Memory Variables Between Different Groups
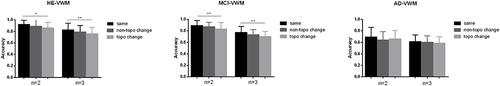
Figure 4 The differences of VWM levels in different size conditions compared to different groups; *p < 0.05. **p < 0.01.