
Figures & data
Table 1 Demographic and biometric characteristics of the studied population
Table 2 Drug treatment in the studied population
Figure 1 Dependency graph of TNF-α (pg/mL) and DES (Spearman R=−0.36, P<0.01).
Abbreviations: DES, Dissociative Experiences Scale; TNF-α, tumor necrosis factor alpha.
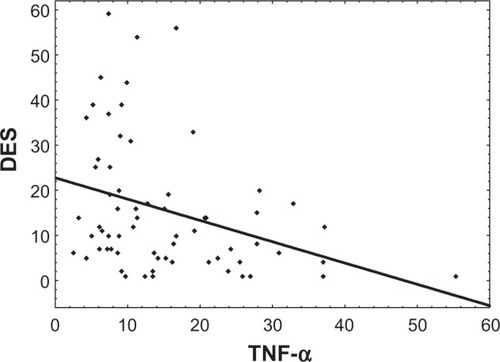
Figure 2 Dependency graph of TNF-α (pg/mL) and SDQ-20 (Spearman R=−0.30, P<0.05).
Abbreviations: SDQ, Somatoform Dissociation Questionnaire; TNF-α, tumor necrosis factor alpha.
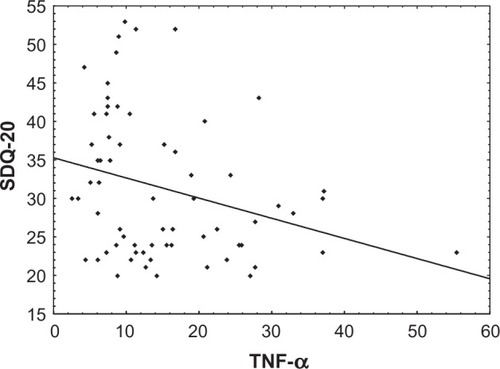
Table 3 Spearman correlations of TNF-α and results of psychometric measures