
Figures & data
Figure 1 Time schedule of the experiment.
Abbreviations: SD, sleep-deprived; NS, normal sleep; PVT, psychomotor vigilance test; POMS, Profile of Mood Status; FCL, Flow Checklist.
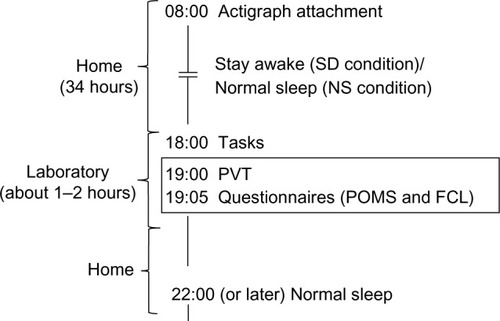
Figure 2 Flow checklist scores (range 1–7).
Notes: *P<0.05; **P<0.01. Confidence refers to “confidence in competence”, challenge refers to “achieving goals”, and immersion refers to “positive emotion and absorption”. Vertical lines (ie, deviation) in the figures show standard errors.
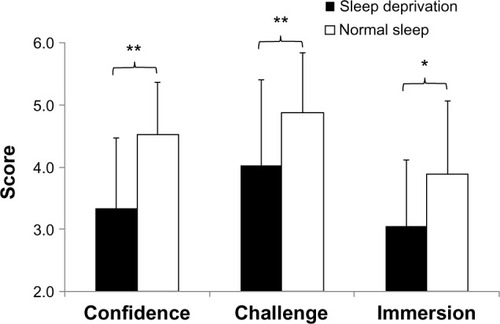
Figure 3 Profile of Mood status scores (range 1–100).
Notes: *P<0.05; **P<0.01.
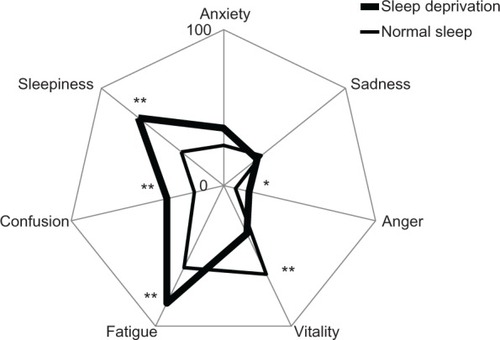
Figure 4 Median reaction times and lapses on psychomotor vigilance testing. The vertical lines (ie, deviation) in the figures show standard errors.
Note: *P<0.05.
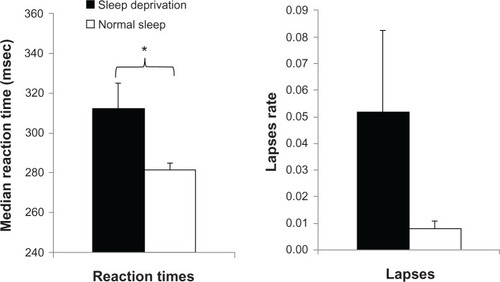
Table 1 Pearson’s product-moment correlation coefficient (r)