
Figures & data
Table 1 Participant demographic data in PBD (n=18) versus typically HC (n=18) subjects
Figure 1 Brain regions with increased/decreased amplitude of low-frequency fluctuation (ALFF) in pediatric bipolar disorder patients are superimposed on a T1 template.
Notes: The ALFF showed a decrease (cold colors) in the left precuneus (d), left superior parietal lobule (e), and bilateral inferior occipital gyrus (c1 and c2), and an increase (hot colors) in bilateral caudate (b1 and b2) and left pallidum (a). The voxels with P=0.001 and a cluster size of 6 were used to identify the clusters with significant differences between the pediatric bipolar disorder and healthy control groups (P<0.05, corrected). Patients versus controls; two-sample t-test; P<0.05, corrected.
Abbreviations: L, left; R, Right.
Abbreviations: L, left; R, Right.
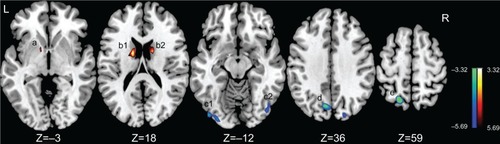
Table 2 Brain regions showing increased/decreased ALFF in PBD versus HC subjects
Figure 2 Scatter plots showing significant positive correlation between total Young Mania Rating Scale scores and regional amplitude of low-frequency fluctuation (ALFF) values in the left pallidum in pediatric bipolar disorder patients (P<0.05).
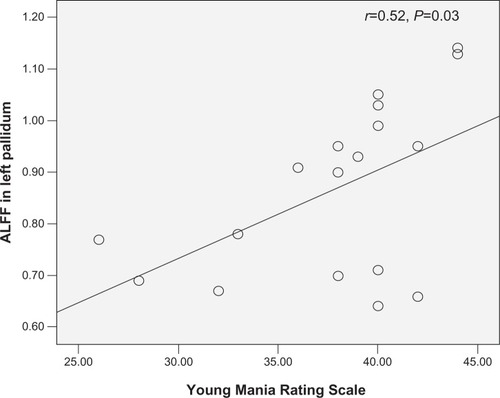
Table 3 Brain regions with significant between-group differences in ALFF and YMRS