Figures & data
Table 1 Patient characteristics and lead locations
Table 2 Results of left-side VC/VS DBS testing with the pulse width at 210 μs and the frequency at 130 Hz
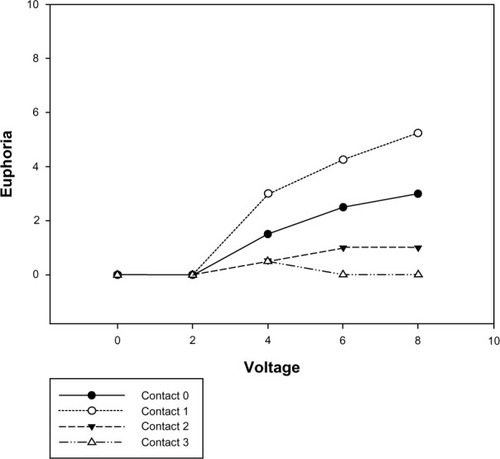
Figure 1 Clinical outcomes at 15 months versus (vs) percentage of smile/laughter conditions of postoperative test stimulation.
Abbreviations: HAM-D, Hamilton Depression Rating Scale; YBOCS, Yale-Brown Obsessive Compulsive Scale.
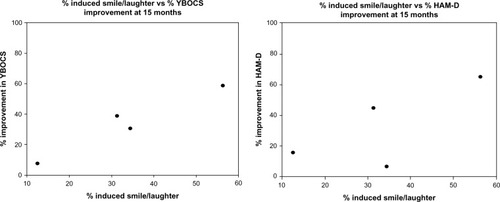
Table 3 Changes in the severity of OCD, depression, and cognition after 15 months of VC/VSDBS
Figure 2 Postoperative test stimulation-induced mood change (euphoria) by lead contact and voltage.