Figures & data
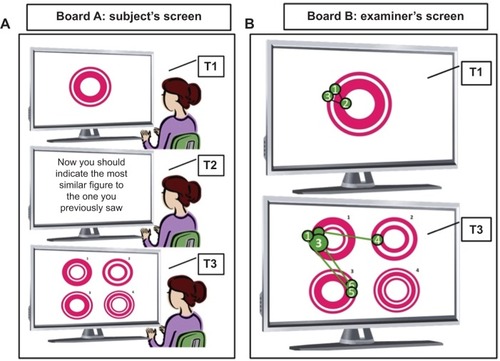
Figure 1 Computerized task used to measure cognitive performance with an eye-tracker device.
Notes: The figure illustrates a task used to measure cognitive performance using an eye-tracker device. T1, T2, and T3 represent three successive movements during the same task. (A) The screen used by the subject during the test. Before he or she begins, the subject is oriented to pay attention to all the images and instructions presented on the screen. At T1, the first stimulus is presented for a limited period of time, longer or shorter depending on the figure’s complexity. At T2, the subject should read the instruction as many times as necessary for him or her to understand what is being asked. When he or she feels ready to accomplish the task, he or she presses any key from the keyboard. At T3, the third screen is presented with the recognition task. In this case, the subject should verbally indicate the figure that perfectly matches the one previously seen, and immediately press a key to continue the test, moving on to the next stimulus. (B) The screen containing representations of the eye movement behavior during test phases T1 and T3. Each green numbered circle represents one eye fixation at that specific part of the screen. The size of the green circle is determined by the duration of fixation: the bigger the circle, the more time the subject spent on that fixation point. The number on each circle represents the sequence of eye fixations.