
Figures & data
Table 1 Descriptive statistics of the participant sample (N=125)
Figure 1 Receiver operating characteristic (ROC) curves for the Teate Depression Inventory (TDI) (red curve).
Notes: The chance line is the green line. The closer the curve is to the upper left hand corner of the graph, the better the diagnostic performance of the TDI. ROC curves were constructed by comparing the nondepressed group versus the mildly depressed group (A); the nondepressed and mildly depressed groups versus the moderately depressed group (B); and the nondepressed, mildly depressed, and moderately depressed groups versus the severely depressed group (C).
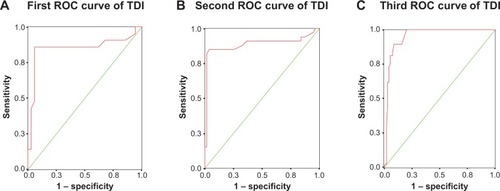
Table 2 Coordinates of the three ROC curves
Table 3 Prediction parameters for total Teate Depression Inventory (TDI) score (N=125)