
Figures & data
Table 1 Demographics of the ADHD sample by sex
Table 2 Demographics in responder (RE) and nonresponder (non-RE) groups
Table 3 Positive effects of medication reported for respondersTable Footnotea
Table 4 Independent samples t-tests showing continuous variables with significant differences between the responder (RE) group and the nonresponder (non-RE) groupTable Footnotea
Figure 1 The independent component cue P3 is decreased in non-responders (non-REs).
Abbreviation: t, time.
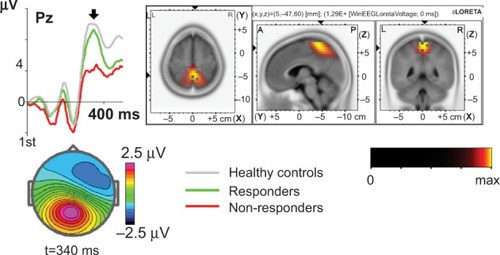
Figure 2 The independent component no-go early is decreased in the responder (RE) group. Left: the independent component for the group of REs (green) and non-REs (red) in comparison with the group of healthy controls (grey). X-axis – time after the onset of the second stimulus in ms. Y-axis – amplitude of the component back-projected and measured at Cz. Right: the standardized low-resolution brain electromagnetic tomography (sLORETA) image of the cortical generators of the component. The scale is shown below. Bottom: the map of the difference REs minus non-REs. The scale is shown on the right.
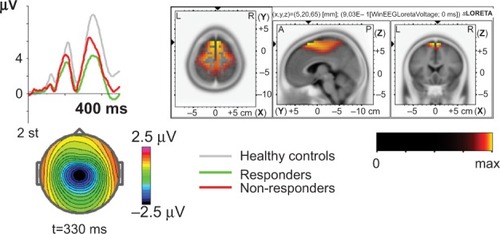
Figure 3 Based on scores combining the three significant variables, patients were placed in four (quartile [Q]) groups. Only 36% in the first group were responders. In quartile groups 2, 3, and 4, 83%, 86%, and 89% were responders.
![Figure 3 Based on scores combining the three significant variables, patients were placed in four (quartile [Q]) groups. Only 36% in the first group were responders. In quartile groups 2, 3, and 4, 83%, 86%, and 89% were responders.](/cms/asset/5786d47e-ab26-4bbf-ba7e-25b5ff07346a/dndt_a_56600_f0003_c.jpg)