
Figures & data
Table 1 Demographic and clinical data on the subjects and the results of Student’s t-test and the chi-squared test between responders and nonresponders
Table 2 Demographic and clinical data on the male and female subjects
Figure 1 ROC curves for all subjects.
Notes: ROC curves for the response at weeks 1, 2, and 4 for all subjects to determine the cutoff points for the MADRS improvement rating. The circles show the ROC curve for week 1 (AUC =0.829), the triangles show the ROC curve for week 2 (AUC =0.764), and the squares show the ROC curve for week 4 (AUC =0.932).
Abbreviations: ROC, receiver operating characteristic; MADRS, Montgomery–Asberg Depression Rating Scale; AUC, area under curve.
Abbreviations: ROC, receiver operating characteristic; MADRS, Montgomery–Asberg Depression Rating Scale; AUC, area under curve.
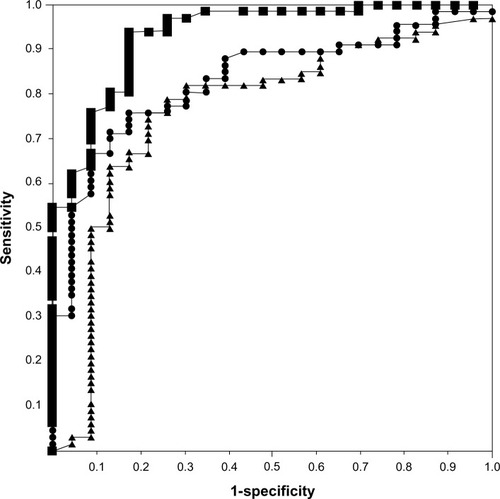
Figure 2 ROC curves in male subjects.
Notes: ROC curves for response at weeks 1, 2, and 4 in the male subjects to determine the cutoff points for the MADRS improvement rating. The circles show the ROC curve for week 1 (AUC =0.908), the triangles show the ROC curve for week 2 (AUC =0.821), and the squares show the ROC curve for week 4 (AUC =0.979).
Abbreviations: ROC, receiver operating characteristic; MADRS, Montgomery-Asberg Depression Rating Scale; AUC, area under curve.
Abbreviations: ROC, receiver operating characteristic; MADRS, Montgomery-Asberg Depression Rating Scale; AUC, area under curve.
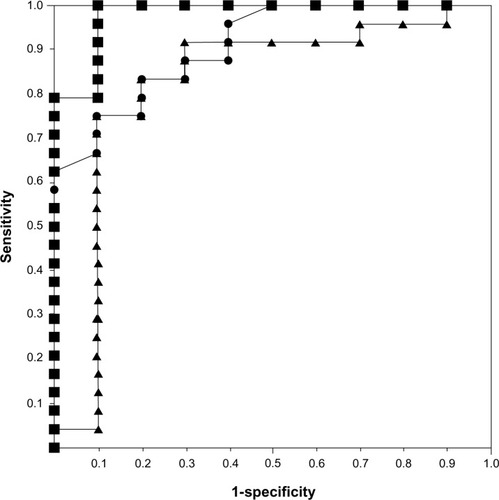
Figure 3 ROC curves in female subjects.
Notes: ROC curves for response at weeks 1, 2, and 4 in the female subjects to determine the cutoff points for the MADRS improvement rate. The circles show the ROC curve for week 1 (AUC =0.781), the triangles show the ROC curve for week 2 (AUC =0.735), and the squares show the ROC curve for week 4 (AUC =0.904).
Abbreviations: ROC, receiver operating characteristic; MADRS, Montgomery-Asberg Depression Rating Scale; AUC, area under curve.
Abbreviations: ROC, receiver operating characteristic; MADRS, Montgomery-Asberg Depression Rating Scale; AUC, area under curve.
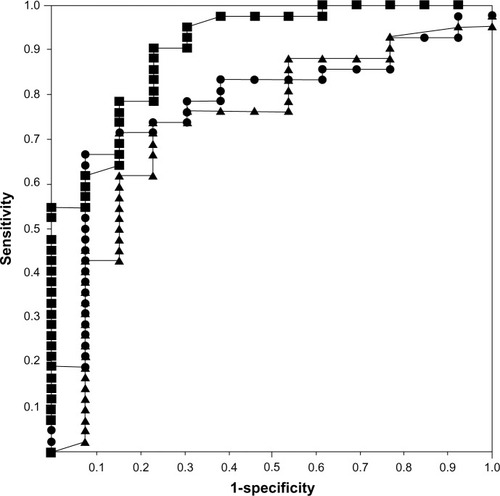
Table 3 The results of ROC curve analysis for total subjects (male and female subjects)