
Figures & data
Table 1 Mean demographic data and scores (SD) of the Mini-Mental State Examination of the normal control, amnestic mild cognitive impairment, and Alzheimer’s disease groups
Figure 1 Virtual radial arm maze test.
Notes: (A) Virtual radial arm maze with six arms in virtual environment. (B) View of virtual radial arm maze from above.
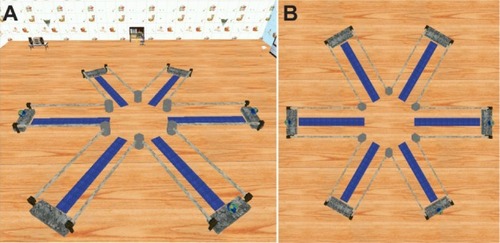
Figure 2 Results of virtual radial arm maze test for the normal control, amnestic mild cognitive impairment, and Alzheimer’s disease groups.
Notes: (A) Mean working memory errors ± standard error (SE); (B) mean reference memory errors ± SE; (C) mean distance ± SE; and (D) mean time latency ± SE to find the hidden rewards across trials in the normal control, amnestic mild cognitive impaired, and Alzheimer’s disease groups for five trials.
Abbreviations: AD, Alzheimer’s disease; aMCI, amnestic mild cognitive impairment; NC, normal control; sec, seconds.
Abbreviations: AD, Alzheimer’s disease; aMCI, amnestic mild cognitive impairment; NC, normal control; sec, seconds.
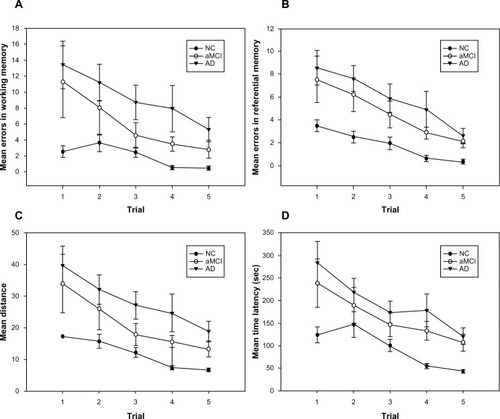
Figure 3 Results of virtual radial arm maze test for the converted and nonconverted amnestic mild cognitive impaired groups.
Notes: (A) Mean working memory errors ± standard error (SE); (B) mean reference memory errors ± SE (significant group effect of P<0.05); (C) mean distance ± SE; and (D) mean time latency ± SE to find the hidden rewards across five trials in converted amnestic mild cognitive impaired (aMCI) and nonconverted aMCI groups within original aMCI group followed-up for 5 years.
Abbreviations: AD, Alzheimer’s disease; aMCI, amnestic mild cognitive impairment; sec, seconds.
Abbreviations: AD, Alzheimer’s disease; aMCI, amnestic mild cognitive impairment; sec, seconds.
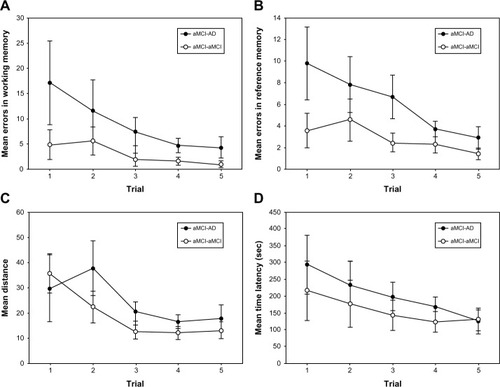
Table 2 Correlations between virtual radial arm maze and neuropsychological tests after controlling for years of education