155
Views
55
CrossRef citations to date
0
Altmetric
Original Research

More female patients and fewer stimuli per session are associated with the short-term antidepressant properties of repetitive transcranial magnetic stimulation (rTMS): a meta-analysis of 54 sham-controlled studies published between 1997–2013

, &
Pages 727-756 | Published online: 07 May 2014

Figures & data

Table 1 Details of the systematic search strategy (all searches were performed in English with no language restrictions)

Figure 1 Study assessment and exclusionary criteria.

Abbreviations: DLPFC, dorsolateral prefrontal cortex; rTMS, repetitive transcranial magnetic stimulation.
Figure 1 Study assessment and exclusionary criteria.

Table 2 rTMS parameters in the N=18 studies included in the current meta-analysis

Table 3 Patient characteristics and depression scores in the active rTMS and sham groups in N=18 studies

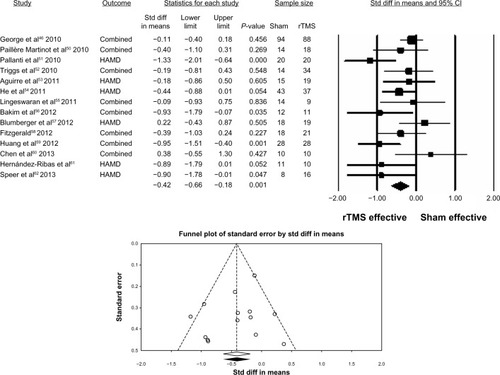
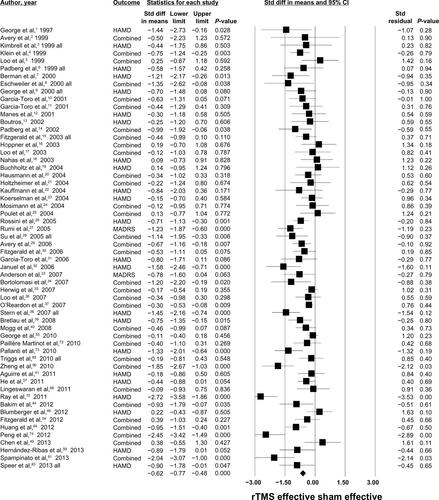
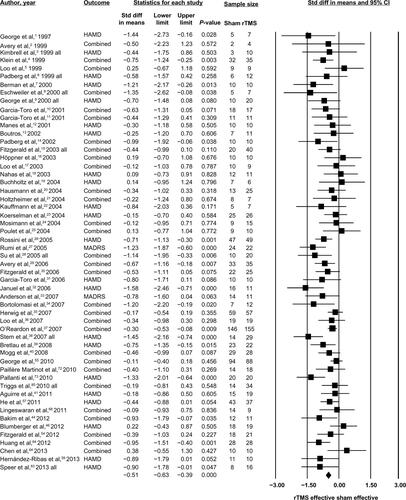
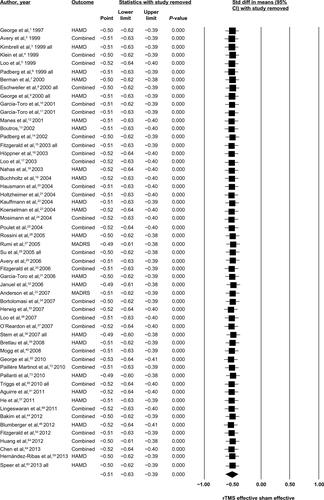
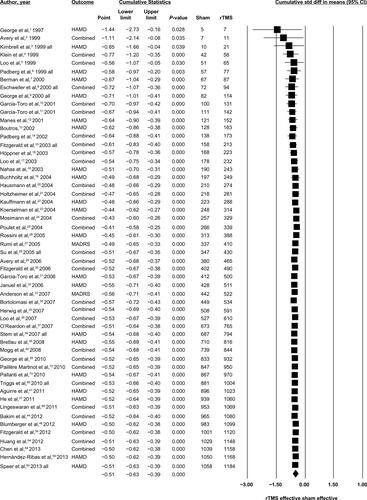
Table 4 Results of the random-effects meta-analysis of the N=14 “new” studies (2010–2013) and all N=54 studies: N=40 “old” studies (1997–2008) and N=14 “new” studies

Figure 2 Random-effects meta-analysis of N=14 “new” studies (2010–2013) comparing the change in mean depression scores on HAMD, BDI, and/or MADRS (baseline – final), after rTMS versus sham.

Notes: In the studies by Triggs et alCitation52 and Speer et al,Citation62 rTMS was administered using different properties into different subgroups of patients in a study and the depression scores for such subgroups were combined. The mean number of patients per group was used in the final calculations if patients dropped out throughout the study between baseline and final sessions. The forest plot (top) shows the weighted effect size d (box) and its 95% CI (vertical line through the box) for each study in the analysis (“combined” indicates that more than one depression scale was used in a study and the effect sizes according to the multiple scales were combined). The diamond depicts the overall mean weighted d of all studies and its 95% CI (width of the diamond). The mean depression scores (baseline – final) were significantly reduced after rTMS compared to sham (overall mean weighted d=−0.41, 95% CI: −0.64, −0.18). The funnel plot (bottom) shows the effect sizes d plotted versus SEM for each study in the analysis. The plot was symmetrical around the overall mean weighted d suggesting that publication bias had little effect on the results of the current meta-analysis.
Abbreviations: BDI, Beck Depression Inventory; CI, confidence interval; HAMD, Hamilton Depression Rating Scale; MADRS, Montgomery Åsberg Depression Rating Scale; rTMS, repetitive transcranial magnetic stimulation; SEM, standard error of mean; Std diff, standardized mean difference d.
Figure 2 Random-effects meta-analysis of N=14 “new” studies (2010–2013) comparing the change in mean depression scores on HAMD, BDI, and/or MADRS (baseline – final), after rTMS versus sham.

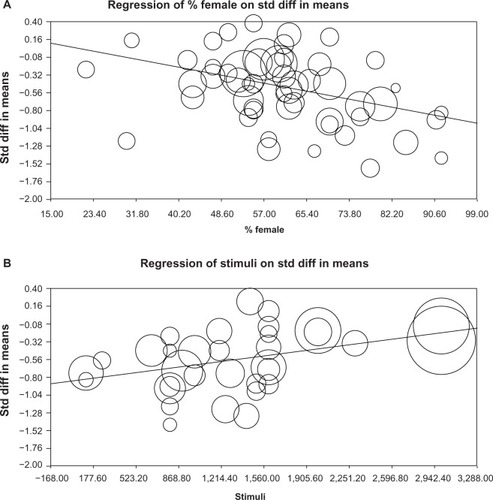
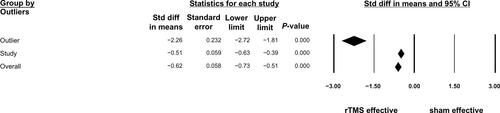
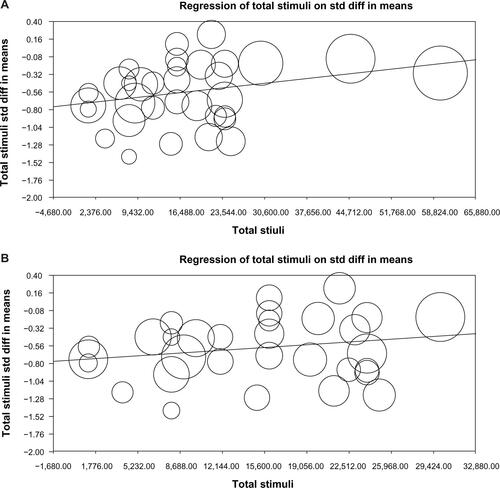
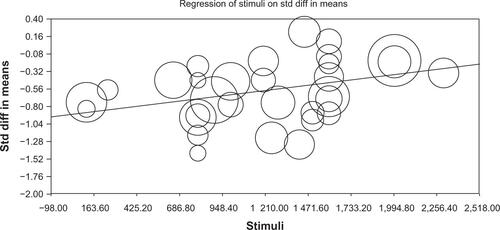
Table 5 Random-effects subgroup analyses and meta-regressions of the change in depression scores (baseline – final) after rTMS compared to sham in N=54 sham-controlled studies published in 1997 – August 2013

Figure 3 Univariate random-effects meta-regressions of various study characteristics used as predictors (proportion of female patients/study and stimuli/session) on the weighted effect sizes d (the outcome) in studies published in 1997–2013.

Notes: The figures are scatterplots of the outcome (weighted d/study; Y-axes) versus predictors (X-axes): (A) proportion of female patients/study and (B) stimuli/session. Depression scores (baseline – final) were significantly reduced after rTMS compared to sham in studies with more female patients and less stimuli/session.
Abbreviations: rTMS, repetitive transcranial magnetic stimulation; Std diff, standardized mean difference d.
Figure 3 Univariate random-effects meta-regressions of various study characteristics used as predictors (proportion of female patients/study and stimuli/session) on the weighted effect sizes d (the outcome) in studies published in 1997–2013.

Figure S1 Random-effects meta-analysis of N=58 studies with standardized residuals and their P-values.

Notes: “All” indicates that rTMS was administered using different properties into different subgroups of patients in a study and the depression scores for such subgroups were combined. “Combined” indicates that more than one depression scale was used in a study and the effect sizes according to the multiple scales were combined). According to the P-values, 4/18 “new” studies were classified as outliers: Zheng et al 2010,Citation90 Ray et al 2011,Citation75 Peng et al 2012,Citation74 and Spampinato et al 2013.Citation81 These studies were excluded from all subsequent analyses.

Abbreviations: CI, confidence interval; HAMD, Hamilton Depression Rating Scale; MADRS, Montgomery Åsberg Depression Rating Scale; rTMS, repetitive transcranial magnetic stimulation; Std diff, standardized mean difference d; Std, standardized.

Figure S1 Random-effects meta-analysis of N=58 studies with standardized residuals and their P-values.Notes: “All” indicates that rTMS was administered using different properties into different subgroups of patients in a study and the depression scores for such subgroups were combined. “Combined” indicates that more than one depression scale was used in a study and the effect sizes according to the multiple scales were combined). According to the P-values, 4/18 “new” studies were classified as outliers: Zheng et al 2010,Citation90 Ray et al 2011,Citation75 Peng et al 2012,Citation74 and Spampinato et al 2013.Citation81 These studies were excluded from all subsequent analyses.Abbreviations: CI, confidence interval; HAMD, Hamilton Depression Rating Scale; MADRS, Montgomery Åsberg Depression Rating Scale; rTMS, repetitive transcranial magnetic stimulation; Std diff, standardized mean difference d; Std, standardized.

Figure S2 Forest plot showing the comparison of the N=4 outliers with N=54 studies.

Notes: Subgroup analysis using the mixed-effects model revealed that the overall mean weighted effect size d was significantly higher in the N=4 outlier studies (d=−2.26) compared to the N=54 studies (d=−0.51): Q(df 1)=58.3, P<0.001. The variability of the weighted effect sizes was high among the N=4 outlier studies (SEM =0.23) compared to the N=54 studies (SEM =0.06).

Abbreviations: CI, confidence interval; rTMS, repetitive transcranial magnetic stimulation; SEM, standard error of mean; Std diff, standardized mean difference d.

Figure S2 Forest plot showing the comparison of the N=4 outliers with N=54 studies.Notes: Subgroup analysis using the mixed-effects model revealed that the overall mean weighted effect size d was significantly higher in the N=4 outlier studies (d=−2.26) compared to the N=54 studies (d=−0.51): Q(df 1)=58.3, P<0.001. The variability of the weighted effect sizes was high among the N=4 outlier studies (SEM =0.23) compared to the N=54 studies (SEM =0.06).Abbreviations: CI, confidence interval; rTMS, repetitive transcranial magnetic stimulation; SEM, standard error of mean; Std diff, standardized mean difference d.

Figure S3 Random-effects meta-analysis of N=54 studies.

Notes: “All” indicates that rTMS was administered using different properties into different subgroups of patients in a study and the depression scores for such subgroups were combined. “Combined” indicates that more than one depression scale was used in a study and the effect sizes according to the multiple scales were combined). The mean number of patients per group was used in the final calculations if patients dropped out throughout the study between baseline and final sessions.

Abbreviations: CI, confidence interval; HAMD, Hamilton Depression Rating Scale; MADRS, Montgomery Åsberg Depression Rating Scale; rTMS, repetitive transcranial magnetic stimulation; Std diff, standardized mean difference d.

Figure S3 Random-effects meta-analysis of N=54 studies.Notes: “All” indicates that rTMS was administered using different properties into different subgroups of patients in a study and the depression scores for such subgroups were combined. “Combined” indicates that more than one depression scale was used in a study and the effect sizes according to the multiple scales were combined). The mean number of patients per group was used in the final calculations if patients dropped out throughout the study between baseline and final sessions.Abbreviations: CI, confidence interval; HAMD, Hamilton Depression Rating Scale; MADRS, Montgomery Åsberg Depression Rating Scale; rTMS, repetitive transcranial magnetic stimulation; Std diff, standardized mean difference d.

Figure S4 One study removed analysis (N=54 studies).

Notes: “All” indicates that rTMS was administered using different properties into different subgroups of patients in a study and the depression scores for such subgroups were combined. “Combined” indicates that more than one depression scale was used in a study and the effect sizes according to the multiple scales were combined). “Point” refers to the overall mean weighted d of all studies except for the study listed in each row.

Abbreviations: CI, confidence interval; HAMD, Hamilton Depression Rating Scale; MADRS, Montgomery Åsberg Depression Rating Scale; rTMS, repetitive transcranial magnetic stimulation; Std diff, standardized mean difference d.

Figure S4 One study removed analysis (N=54 studies).Notes: “All” indicates that rTMS was administered using different properties into different subgroups of patients in a study and the depression scores for such subgroups were combined. “Combined” indicates that more than one depression scale was used in a study and the effect sizes according to the multiple scales were combined). “Point” refers to the overall mean weighted d of all studies except for the study listed in each row.Abbreviations: CI, confidence interval; HAMD, Hamilton Depression Rating Scale; MADRS, Montgomery Åsberg Depression Rating Scale; rTMS, repetitive transcranial magnetic stimulation; Std diff, standardized mean difference d.

Figure S5 Cumulative meta-analysis (N=54 studies).

Notes: “All” indicates that rTMS was administered using different properties into different subgroups of patients in a study and the depression scores for such subgroups were combined. “Combined” indicates that more than one depression scale was used in a study and the effect sizes according to the multiple scales were combined). “Point” refers to the overall mean weighted d of all studies before and including the study listed in each row.

Abbreviations: CI, confidence interval; HAMD, Hamilton Depression Rating Scale; MADRS, Montgomery Åsberg Depression Rating Scale; rTMS, repetitive transcranial magnetic stimulation; Std diff, standardized mean difference d.

Figure S5 Cumulative meta-analysis (N=54 studies).Notes: “All” indicates that rTMS was administered using different properties into different subgroups of patients in a study and the depression scores for such subgroups were combined. “Combined” indicates that more than one depression scale was used in a study and the effect sizes according to the multiple scales were combined). “Point” refers to the overall mean weighted d of all studies before and including the study listed in each row.Abbreviations: CI, confidence interval; HAMD, Hamilton Depression Rating Scale; MADRS, Montgomery Åsberg Depression Rating Scale; rTMS, repetitive transcranial magnetic stimulation; Std diff, standardized mean difference d.

Figure S6 Univariate meta-regression of the total stimuli/study on the effect size d weighted according to the random-effects model.

Notes: Total stimuli = stimuli/session × total number of sessions. (A) The top figure shows the results of a significant meta-regression (slope P=0.015) in N=33 studies. However, the significance of this regression was due to two largest RCTs by O’Reardon et alCitation37 and George et alCitation55 (depicted as two largest circles on the right-hand side of (A). (B) These two RCTs are removed from the analysis in the bottom figure (slope, P=0.208).

Abbreviations: RCT, randomized controlled trial; std diff, standardized mean difference d.

Figure S6 Univariate meta-regression of the total stimuli/study on the effect size d weighted according to the random-effects model.Notes: Total stimuli = stimuli/session × total number of sessions. (A) The top figure shows the results of a significant meta-regression (slope P=0.015) in N=33 studies. However, the significance of this regression was due to two largest RCTs by O’Reardon et alCitation37 and George et alCitation55 (depicted as two largest circles on the right-hand side of (A). (B) These two RCTs are removed from the analysis in the bottom figure (slope, P=0.208).Abbreviations: RCT, randomized controlled trial; std diff, standardized mean difference d.

Figure S7 Univariate meta-regression of the stimuli/session on the effect size d weighted according to the random-effects model (two largest RCTs removed).

Notes: The slope of meta-regression conducted on N=31 studies remained positive and statistically significant (P=0.018) following the removal of O’Reardon et alCitation37 and George et alCitation55 studies.

Abbreviations: RCT, randomized controlled trial; std diff, standardized mean difference d.

Figure S7 Univariate meta-regression of the stimuli/session on the effect size d weighted according to the random-effects model (two largest RCTs removed).Notes: The slope of meta-regression conducted on N=31 studies remained positive and statistically significant (P=0.018) following the removal of O’Reardon et alCitation37 and George et alCitation55 studies.Abbreviations: RCT, randomized controlled trial; std diff, standardized mean difference d.

Table S1 A list of N=40 “old” studies on the association between rTMS from our previous meta-analysis (unpublished). These studies were included in sensitivity and moderator analyses in the current study

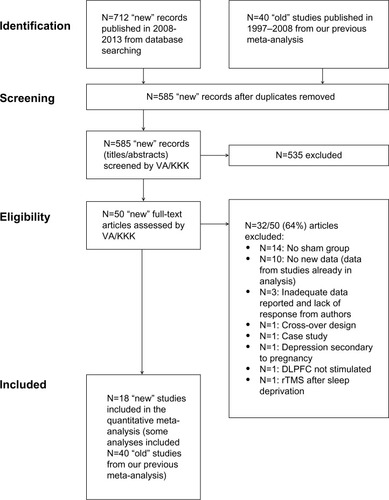
Table S2 A list of N=50 studies on the association between rTMS and depression assessed in full-length and reasons for exclusion from the current meta-analysis

Table S3 Location (country) where the N=54 studies published from 1997 to August 2013 were conducted