Figures & data
Figure 1 Principles of the moving-minimum subtraction method.
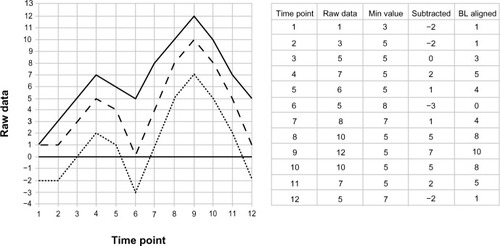
Figure 2 Application of the moving-minimum subtraction method on authentic auditory brain-stem responses (ABRs) from four subjects (subjects A–D) with highly variable waveforms.
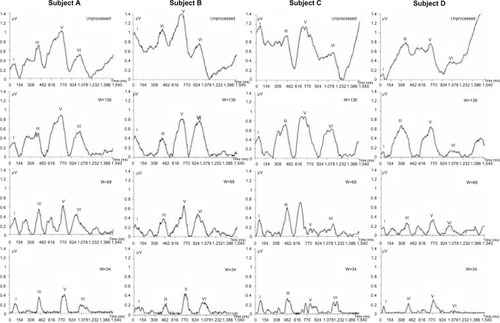
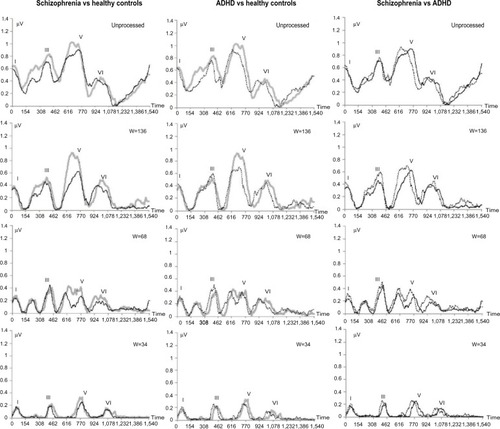
Figure 3 Median auditory brain-stem response (ABR) waveforms of ten healthy volunteers (gray curve) compared with ten patients with schizophrenia (black curve, left panels) and with ten patients with adult attention deficit/hyperactivity disorder (ADHD) (dotted curve, middle panels), respectively. The schizophrenia and ADHD groups are directly compared in the right panels. The authentic analog waveforms were digitized to allow baseline alignments according to the moving-minimum subtraction method using three windows (W=136, W=68, W=34 data points), and to allow descriptive statistics of groups and statistical analyses of group differences.