
Figures & data
Table 1 Means and standard deviations of the variables between sexes
Table 2 Indicators of fit for models (log likelihood based) in male sample
Table 3 Indicators of fit for models (log likelihood based) in female sample
Figure 1 Latent class model in male and female samples.
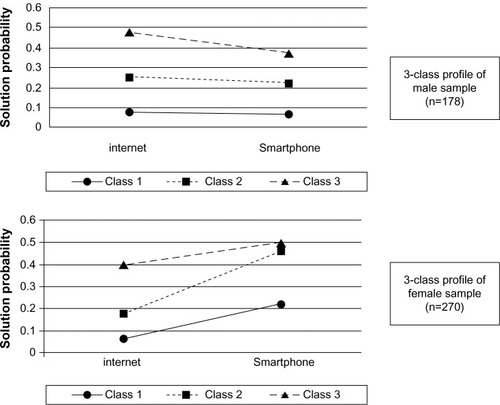
Table 4 Analysis of cross-class comparison between sexes