Figures & data
Figure 1 Comparison of 11C-CFT PET imaging before and after deep brain stimulation in patient’s right subthalamic nucleus.
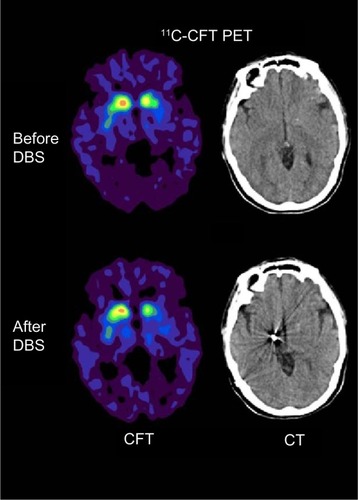
Figure 2 (A–C) Pre-DBS and post-DBS plots demonstrating progressive bilateral decreases (percentage relative to parieto-occipital reference) of post-DBS 11C-CFT dopamine transporter binding in the anterior putamen (A), posterior putamen (B) and caudate (C) after one year. Stimulation was performed on the right side. (D) The UPDRS score for the left limbs was similar to that of the right limbs before and after DBS.
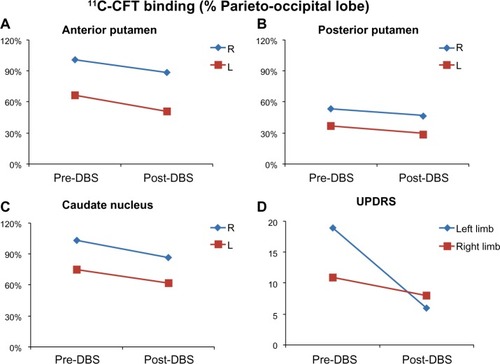
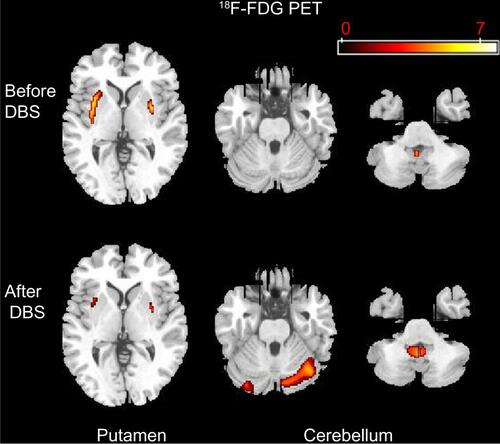
Figure S1 Comparison of 18F-FDG PET imaging before and after deep brain stimulation in patient’s right subthalamic nucleus.
Abbreviations: 18F-FDG PET, fluorodeoxyglucose positron emission tomography; DBS, deep brain stimulation.