
Figures & data
Figure 1 Patient disposition (number of patients who were assigned, treated, and who completed the treatment with the reasons for discontinuation).
Abbreviations: N, number; RIS, risperidone; BNS, blonanserin.
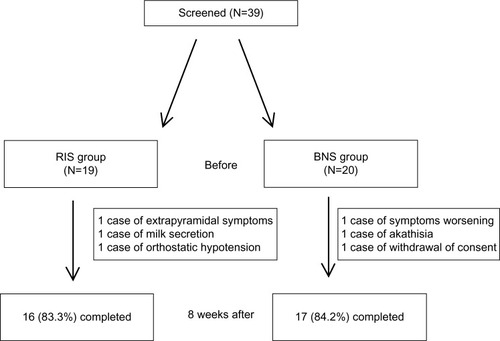
Table 1 Demographic and clinical characteristics of the patient sample at baseline
Table 2 PANSS score changes for the risperidone and blonanserin groups
Table 3 “Time × group” interaction effect on analysis of variance with BACS-J and LASMI data when compared with the BNS group
Table 4 Paired t-test results on BACS-J and LASMI data for the BNS group
Table 5 Paired t-test results on BACS-J and LASMI data for the RIS group
Table 6 The relationship between RIS and BNS doses and BACS-J scores at 8 weeks