Figures & data
Table 1 Baseline demographic and clinical characteristics of the study population
Figure 1 Effect of treatments. IRS, BPRS, CGI –Severity of illness, PANSS – Positive subscale, PANSS – Negative subscale, and PANSS – General subscale scores at baseline (day 0) and endpoint (day 70) in patients treated with quetiapine (n=8) or olanzapine (n=7).
Notes: Data are expressed as mean ± SEM; **P≤0.01; ***P≤0.001, two-way analysis of variance for repeated measures followed by Bonferroni post-hoc test for multiple comparisons.
Abbreviations: BPRS, Brief Psychiatric Rating Scale; CGI, Clinical Global Impression Scale; IRS, Impulsivity Rating Scale; PANSS, Positive and Negative Syndrome Scale.
Abbreviations: BPRS, Brief Psychiatric Rating Scale; CGI, Clinical Global Impression Scale; IRS, Impulsivity Rating Scale; PANSS, Positive and Negative Syndrome Scale.
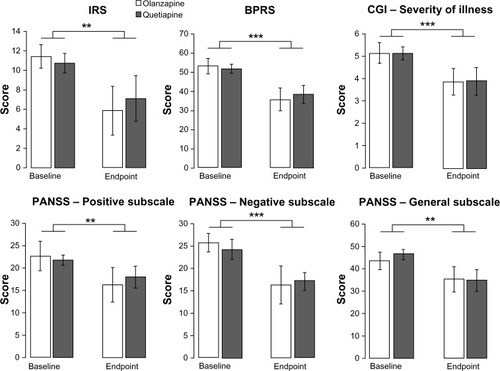
Table 2 Effects of treatments
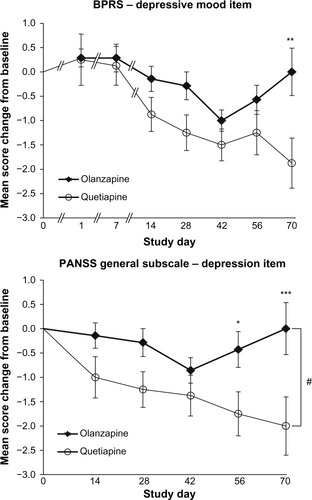
Figure 2 Time course of the depression items mean score change from baseline in the BPRS (top) and PANSS (bottom) in patients treated with quetiapine (n=8) or olanzapine (n=7).
Notes: Data are expressed as mean ± SEM; *P<0.05; **P<0.01; ***P<0.001, quetiapine versus olanzapine; #P<0.05, effect of treatment; two-way analysis of variance for repeated measures followed by Bonferroni post-hoc test for multiple comparisons.
Abbreviations: BPRS, Brief Psychiatric Rating Scale; PANSS, Positive and Negative Syndrome Scale.
Abbreviations: BPRS, Brief Psychiatric Rating Scale; PANSS, Positive and Negative Syndrome Scale.