
Figures & data
Figure 1 Participant flow diagram.
Abbreviations: GP, group psychoeducational program; TAU, treatment as usual.
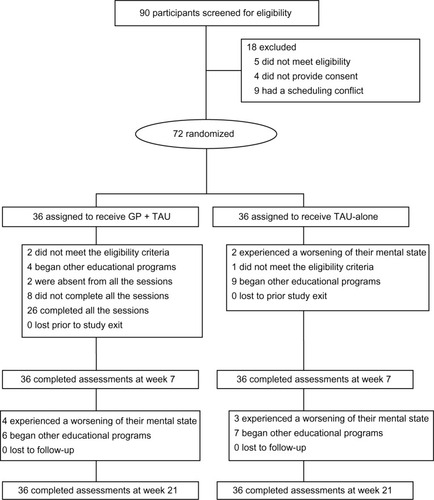
Table 1 Baseline sociodemographic and clinical characteristics of participants
Figure 2 Total scores of the 28-item General Health Questionnaire at baseline, week 7, and week 21.
Note: *P<0.05.
Abbreviations: GP, group psychoeducational program; TAU, treatment as usual.
Abbreviations: GP, group psychoeducational program; TAU, treatment as usual.
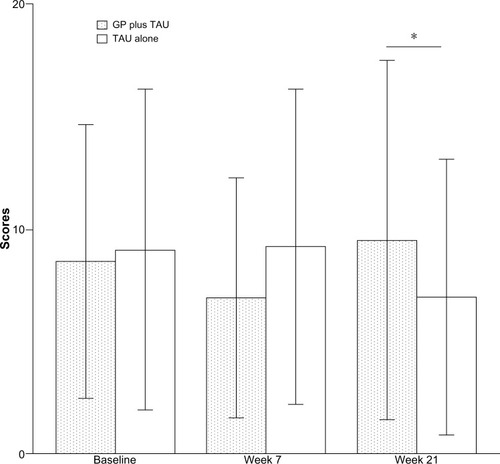
Table 2 Results of primary outcome
Figure 3 Total scores of the Aberrant Behavior Checklist at baseline, week 7, and week 21.
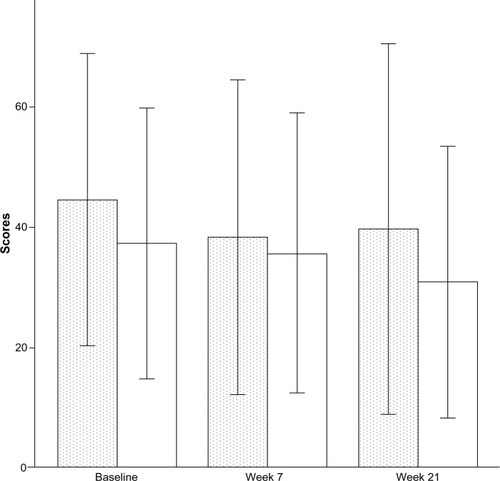
Table 3 Results for each secondary outcome measure with unpaired t-test
Table 4 Adjusted results for each secondary outcome measure
Table 5 Completer analysis