
Figures & data
Figure 1 Schematic diagram of the distribution of eleven SNP loci in the DRD1 gene.
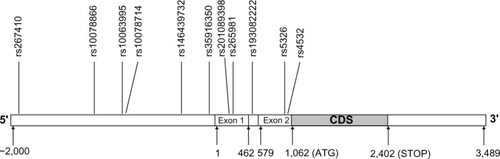
Figure 2 Linkage-disequilibrium diagram of eleven single-nucleotide polymorphism loci in DRD1. The top row represents the disease group, while the bottom shows the control group; the left is r2, and the right is D′. The black grid represents r2=1; the blank grid represents D′=1.
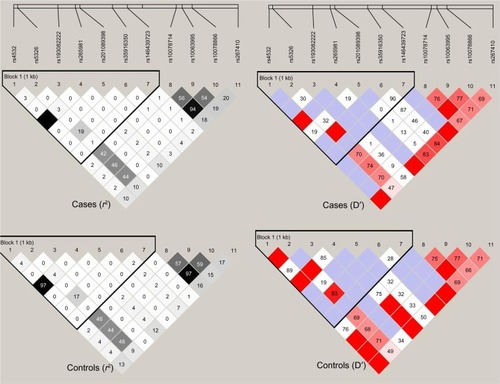
Table 1 Distribution of genotype frequencies, allele frequencies, and disease risk at the eleven SNP loci in DRD1 for the control and disease groups
Table 2 Haplotypes formed by the seven SNP loci in DRD1 and disease risk
Table 3 Haplotypes formed by the remaining four SNP loci in DRD1 and disease risk
Table 4 Distribution of genotype frequency and disease risk at two SNP loci in DRD1 for sex in control and disease groups