Figures & data
Table 1 Review of previous studies
Figure 1 A typical 1H spectrum and the spectroscopic volume of interest: left dorsolateral prefrontal cortical region.
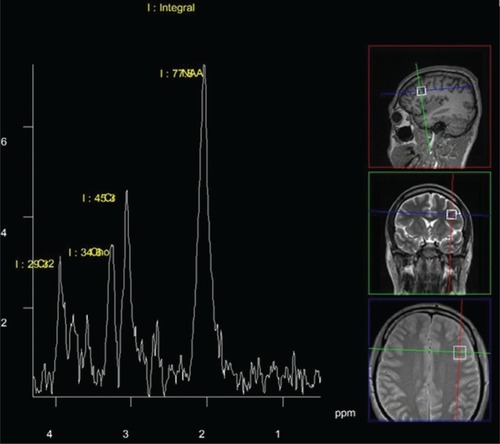
Table 2 Sociodemographic characteristics of the two investigated groups
Table 3 Differences in measured values found across the group taking more than one antipsychotic drug (N=15) – Wilcoxon test
Table 4 Differences in measured values found across the group sticking to the same antipsychotic drug throughout the study course (N=10) – Wilcoxon test
Table 5 Spearman’s correlation coefficients (rho) between functional outcome and NAA/Cr level at the beginning of the study and after 12 months
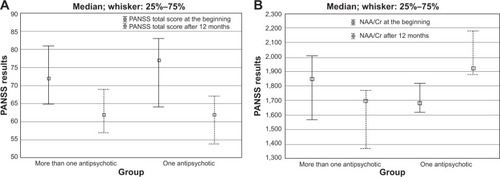
Figure 2 Comparison of NAA/Cr levels between two groups that had more than one antipsychotic, or had one antipsychotic.
Abbreviations: Cr, creatinine; NAA, N-acetylaspartate; PANSS, Positive and Negative Syndrome Scale.